Hi everyone! I’ve been trying to perform some CFD simulations on Eddy3d to obtain the 8760 wind values to couple with the UTCI or PET analysis component. I’ve tried to copy the wind values from the EPW file to a .csv file with the number of colums matching the number of points of analysis, tried to link directly the results from a .csv generated by Eddy3d with the 8760 values, and also tried to link directly the results from a component to another (the results from Eddy to the PET or UTCI analysis component) but neither of the cases above worked  , it shows (wind speed values not recognized). Could some one help me with this? Which is the best way to account for wind speed values on comfort simulations performed by Honeybee? I’m out of strategies to do this.
Hope everyone is fine and well.
Cheers.
D.C
You will need to use Ladybug create LB header component and create a list with Ladybug header that the UTCI component understands. Do this, and you should be able to use your wind velocities.
Hi @devang , I tried using Ladybug create LB header, and now I’m still getting this error "1. windSpeed_ must be either a list of 8760 values that correspond to hourly changing wind speeds over the year or a single constant value for the whole year.’ for the UTCI comfRecipe component, I tried each step I mentioned above, creating a .csv file with the number of colums matching the number of analysis points, I tried even creating a panel with the 8760 values coming from CFD results, but this error remains, do you have any idea what could be causing this?
I will try coupling the results from the CFD simulation directly and see how it goes
MAPA PET ATRIBUINDO SENSORES.gh (672.1 KB)
This is the workflow I’m setting up, but still not working ):
hey @Dconforte,
The geometries in your file were not internalized and also without your csv file, it’s hard to help.
In a nutshell you need a list of 8760 values that you can plug into the data input
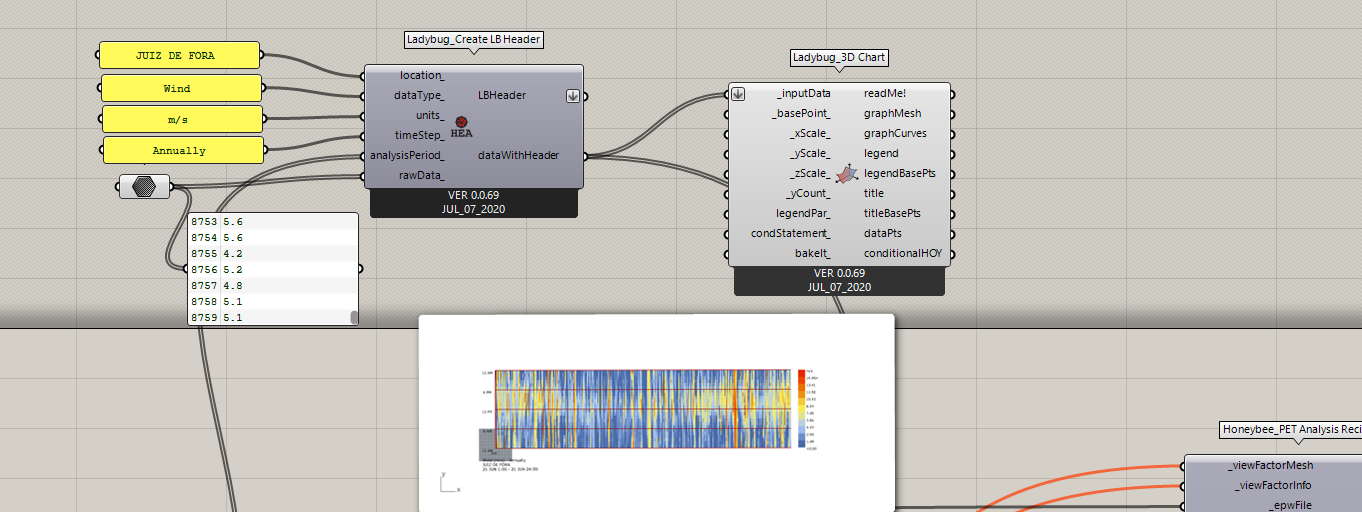
You might need to use a plugin like bumblebee to read data from your csv file. One good way to check if Ladybug understands your data is to plot a 3D chart like I have done.
In order to generate a valid csv of wind velocities, you can follow this method of calculating wind factors.
@devang you just saved a young student, much appreciate it, sorry for the missing information, you have been trully helpful. With the wind speed values, am I able to extract the comfort indices or temperature values on certain points? I’m trying to extract a .csv file from PET analysis simulations on some points that I established on sunlit areas and shaded areas so I can compare the values, but unfortunately the .csv file shows the exact same value for all my analysis points, got any idea why is this happening? Or is there another workflow I can follow to obtain these values?
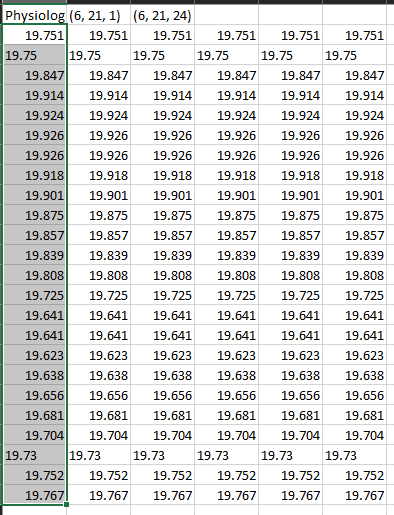
This screenshot refers to the PET index, and the values are all the same, for sunlit and shaded areas and I got no clue why
@Dconforte,
I believe this is a separate question. You should start a new thread and share a simplified version of your file with necessary information internalized.
Ok then! Just did it, sorry to bother and thanks for your help