I have noticed that the glazing conduction is always coming through the Energy Balance component as negative, and wonder if anyone could help describe it to me?
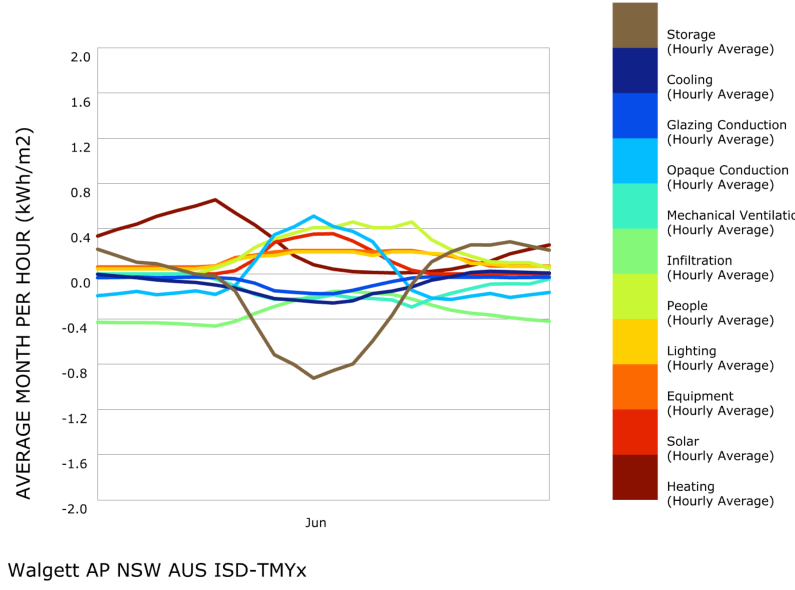
This image is taken from the average month hourly output for January - summer in Australia! Note the medium blue glazing conduction is negative.
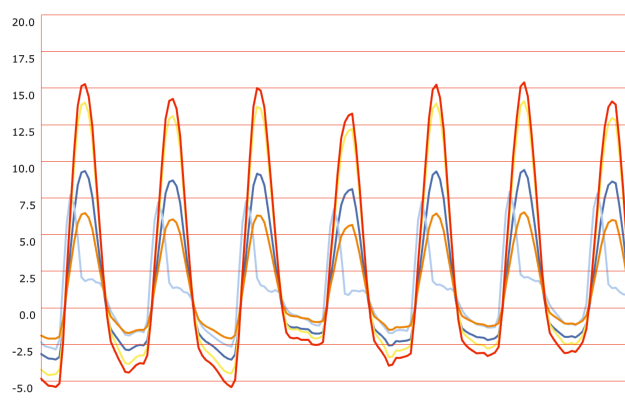
To verify this I looked at the read ep surface outputs. The glazing conduction should match the glazed surface energy flows MINUS the the window total solar energy. I have graphed this below and note a positive conduction gain during the day for all windows in the same period.
I’ve attached a link to the results folder, and the part of the script that processed these graphics.
I’ve also noticed the idf not coming through as closed breps, and giving a different result to the original HBZones through the Energy Balance Calculator. Still negative conduction gains though. 2020.02.18_EnergyBalanceError.gh (597.0 KB)
Are you sure the overall negative conduction gain there isn’t just a consequence of the monthly averaging? What does the hourly conduction gain look like during the summer evenings?
Apologies if you’ve already tried this, but have you taken the hourly glazing conduction loads and “manually” calculated the average of the first 31 days (744 hours) using Grasshopper or excel? If so, does it not match the monthly balance you have?
I’d check your GH file, but currently don’t have access to Rhino.
I believe this function is taking an average for each of the 24 hours, over the range of a month. This gives an average day hourly profile.
So, you’d expect the daytime conduction to be positive in summer. I’d plotted those values on the untitled chart over the month and they were consistently positive during the day. ie, the manually averaged approach does not match the outputs of the energy balance component.
Also checked in excel by manually averaging the values, and on another model in another weather file with no skylights - seems to be a definition?
While typically the energy balance is done monthly to account for it’s steady-state assumption, I can’t think of anything in the energy balance formula that would cause that kind of error if you averaged the day. Could be a bug. I’ll try and take a look at your GH file later today.
Thanks Saeran,
I’ve noticed in the file I’ve uploaded that (because I’d deleted the setup and the simulation) I couldn’t retrieve a glazing conduction load in the energy balance - so I’ve attached a trimmed down full file here that duplicates the error. ErrorCheck_FullScript.gh (756.7 KB)