Dear all,
After simulating in Honey BEE i have check the idf file and now
I am performing a simulation assuming the following parameters
SurfaceConvectionAlgorithm:Inside,TARP
SurfaceConvectionAlgorithm:Outside DOE 2 -Heat Balance algorithm: ConductionTransferFunction
Zone air heat balance :AnalyticalSolution
I have assessed the uvalue of a wall without surface thermal resistances because are both calculated by Eplus itself per each timestep.
Assuming that my wall has an U value of x W/m2K and i want to check if this value is the actual one calculated by the software, should I have to subtract from
and then divided it by the difference in temperature btw indoor and outdoor and the overall area? ( case without take into account conductive solar gain)
Following the previous for a wall of 0.98 W/m2K after the permutations i get a result that is almost two times. Why?
Furthermore If i divide the Surface Avg Face Conduction Rate by the difference in temperature btw indoor and outdoor and the overall area (without solar conductive gain) i don’t get a result that is equal to the sum of the above mentioned uvalue plus the outside and inside convective coefficients .
Did I forget something?
I am very concerned because I want to check manually the reliability of the results and i still don’t get any correct Uvalue, thus leading to higher loads.
I think this question may be better asked on unmethours, where people can tell you how the EnergyPlus conduction algorithms work and which outputs will tell you the most about them:
Before posting, I’d recommend pausing to consider the difference between a U-value and the actual heat flow through a construction in a real building’s constructions. U-values are like the kilometers-per-liter (or miles-per-gallon) metric for a car. Just because your car gets 40 miles per gallon on the highway does not mean that you always get this same mileage everywhere you drive it. Similarly, just because your construction has a certain U-value under NFRC conditions does not mean that you always get that heat flow per degree Kelvin when you put it in a real building.
Particularly if the construction is placed under conditions that are far from NFRC (like if you have changing temperatures on the outdoors and different amounts of sun falling on the construction), I would expect very different behavior than what a single NFRC U-value would predict. Perhaps with more information about why you are trying to do this evaluation of E+ heat flow, I could point you towards more helpful resources.
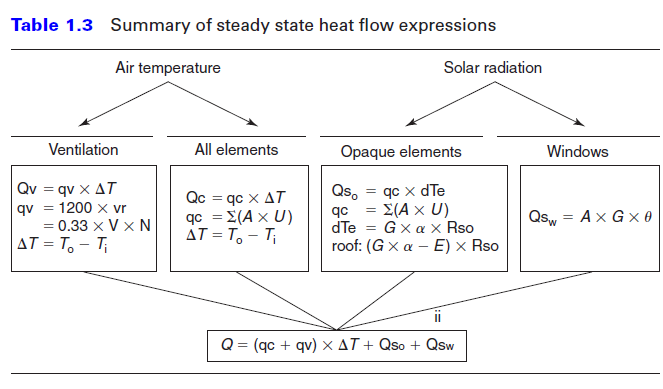
I am actually interested in perform manually quick checks of the results from Energy plus, in order to be sure if the outputs could be reasonable or not, using steady state equations taken from the main law of Technical Physics (conduction across element, convection, heatbalance, thermal loads).
So far,
I am able to manually verify the convection load due to natural ventilation (sensible and latent) and infiltration.
I am aware of how each variable affects the other when dealing with air heat balance.
However I don’t know exactly how to deal with heat balance of the envelope, and In particular i haven’t found useful info regarding the way eplus calculates the U value listed in the idf reports and the unique u-value films provided (surface resistance) since in a dynamic simulation they should vary over time.
Having said that, I have been doing some permutations in order to verify that [Surface Avg Face Conduction Rate/ (Outdoor DBt-Zone Mean Air Temperature)] gave the overall U value , which I have manually calculated under the condition of the absence of solar radiation. The results were almost 2-3 times than the expected. Even subctracting the effect of the indoor/outdoor Surface Convection Heat Transfer, i still get results that are still too high.
I am quite sure that I haven’t fully understood which are the Eplus variables that define the heat balance per each opaque and transparent component.
If you may have any publications/articles that may have addressed this topic and you can share with us It would be highly appreciated. I have checked many times the Eplus I/O reference and Eng. reference without solution.
I’m surprised the EPlus Engineering reference doesn’t help you? I thought it did go into quite some detail about how the CTFs work.
Have you checked to see if [Surface Avg Face Conduction Rate] / [delta T of interior/exterior wall surface temperatures] = the assembly U-value? i.e neglecting the contribution of the surface air films? At the very least that should work, if under true steady state conditions (you could remove all radiation data from the epw file to force a true steady state condition). Then at the very least you can isolate the discrepancy to the air films.
Have you checked to see if [Surface Avg Face Conduction Rate] / [delta T of interior/exterior wall surface temperatures] = the assembly U-value?
This is what i have been doing so far: that is why I am unsure of the results of my thermal loads.
Actually , the hour taken into consideration is 5 in the morning and I have also noticed that interior and exterior surface temperature are almost the same, that is bit strange since I have massive wall.
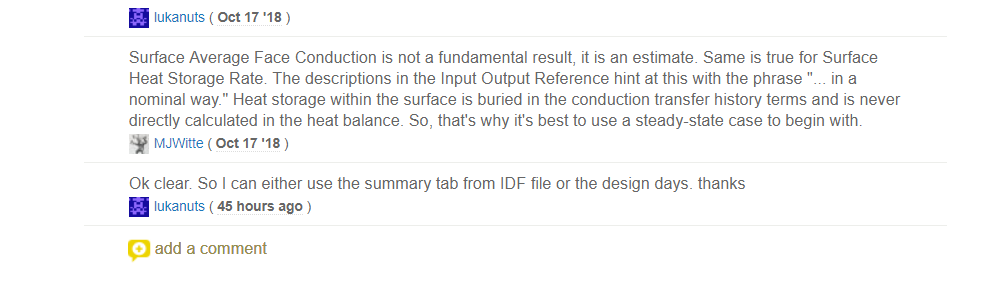
On the way round the idf Report, gives the correct result per each construction.
I used the “EP No Mass” materials, and took the surface energy and temperature delta at 4 in the morning during the extreme cold week (steady-state-like conditions).
How did you select the extreme cold week? Have you carried on a climate analysis or you have a specific epw for design days?
Could you send me the generated idf as well?
Have you used an Rvalue material alone?
In EnergyPlus, there are two possible cases for the existence of “no mass” layers: either between
two other solid, thermally massive layers (multiple “no mass” layers next to each other are simply
combined in this approach) or at the inner or outer most layers of a construction. There are potential issues with having a resistance-only layer at either the inner or outer most layers of a construction. A little or no mass layer there could receive intense thermal radiation from internal
sources or the sun causing the temperature at the inner or outer surface to achieve very high
levels. This is undesirable from a simulation standpoint as there are limits to temperature levels in
EnergyPlus that could be exceeded causing the simulation to terminate and is likely unrealistic from
a real-world perspective. Thus, for such potentially problematic calculational scenarios, EnergyPlus
will continue to convert a “no mass” layer at either the inner or outer most layer of a construction
into a thermal mass layer using the properties of air as has been done in the past.
The case where a resistance-only layer is defined anywhere except the inner or outer layer of a
construction is handled by treating the “no mass” layer as a single node layer. This will result in
a node at each interface as in the standard material layer cases.
(from E+ 8,9 Engineering references) Did you get any errors of the above kind? Because i used to experience a fatal error within the simulation.
I took the extreme cold week from the .stat file, using the ‘import stat file’ component, and then did a climate analysis. Heating design day would have been better (no sun), but I’m just not familiar with how to extract that. I simply ran the simulation, and found the outdoor surface temperatures that had stabilized into steady-like conditions (in my case at 4 am), and used that for the U-Value derivation.
Yeap, you can extract that from the attached .gh file. Run the simulation, and the export to OpenStudio component will give you the file address of the idf file.
I think this should only happen if you have high solar radiation levels and a high conductance material, so you can avoid it by changing either case. For this study, you ideally don’t even need the sun. And yes, the whole point of the exercise I suggested was to force a steady-state like condition - which means you can’t have any thermal mass in your constructions For the simple reason that the thermal energy stored in the various masses over successive simulation runs will be almost impossible to track and account for in any surface heat balance to derive your U-Value.
I will try to do that, and get back to you.
From my experience, whatever is the material i can’t run the simulation.
But the point is: if i clear identify all the components of the heat balance, why can’t I get the U value (no sunlight and removing the superficial resistances)?
at the end of the day If I remove the convective rates and the heatstorage one i should obtain the correct amount conductive transfer rate to be divided by the delta btwn indoor and outdoor surface temperature).
T_t = Temperature in slab mass at timestep t
T_t+dt = Temperature in slab mass at timestep t + deltat
(T_t+dt - T_t) = Temperature change over timestep
Q_x = Heat power at slab surface 1
Q_x+dx = Heat power at slab surface 2 (i.e dx distance away from x)
Q_x+dx - Q_x = Change in heat power through the slab
So the heat energy over the timestep is equal to the change in heat power entering and leaving the slab. Unlike in the steady-state condition where heat power was the same on both sides of the slab.
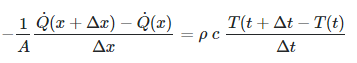
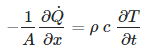
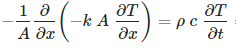
If you want to solve for U in this you have to find the derivative of deltaQ with respect to x, and deltaT with respect to t:
taking the limits of dx and dt:
subbing in Fourier’s law for Q:
So basically, extracting the -k/dx = U value here for a single timestep where net heat power transfer is not zero (i.e non-steady-state) involves either taking the integral of both sides, or modeling it as a differential equation.
Update: I just finished discussing this with a colleague of mine, and he explained how extraction of the U-value could be possible in a transient-state simulation.
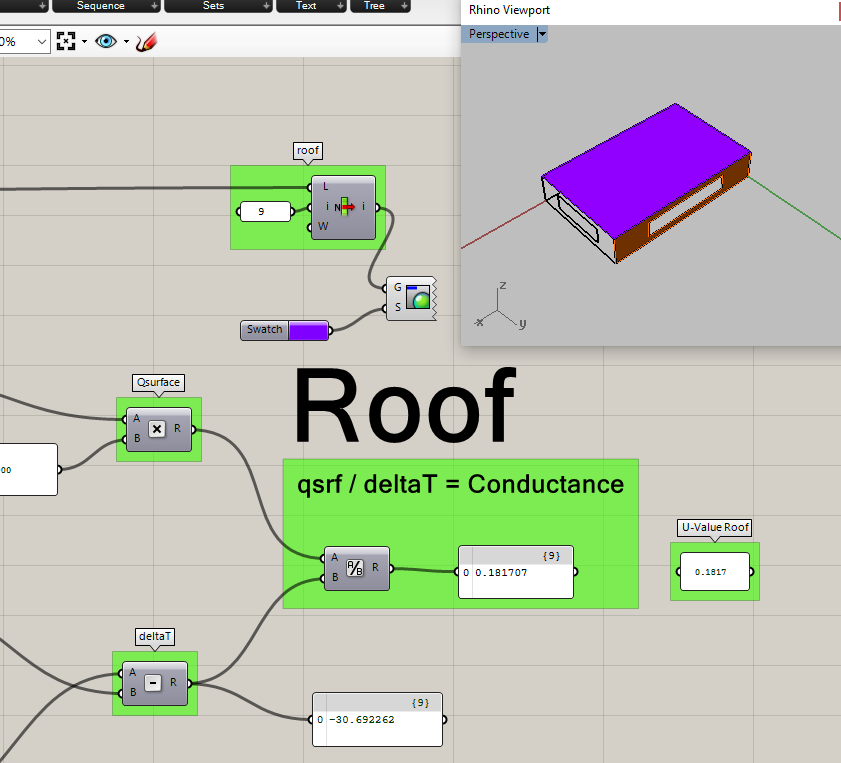
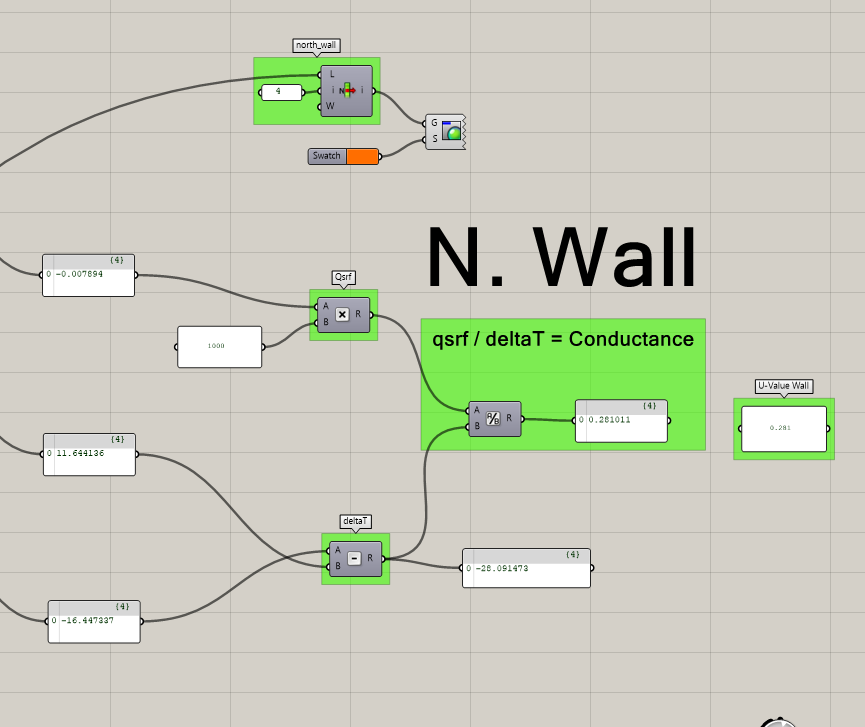
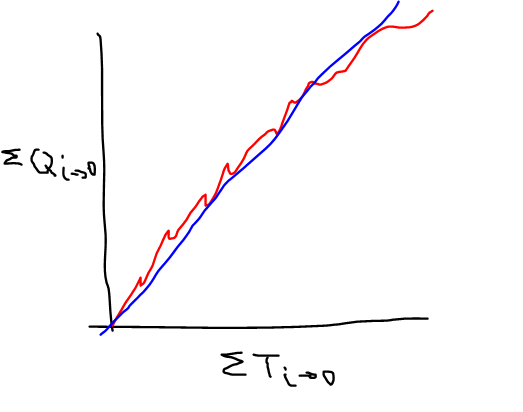
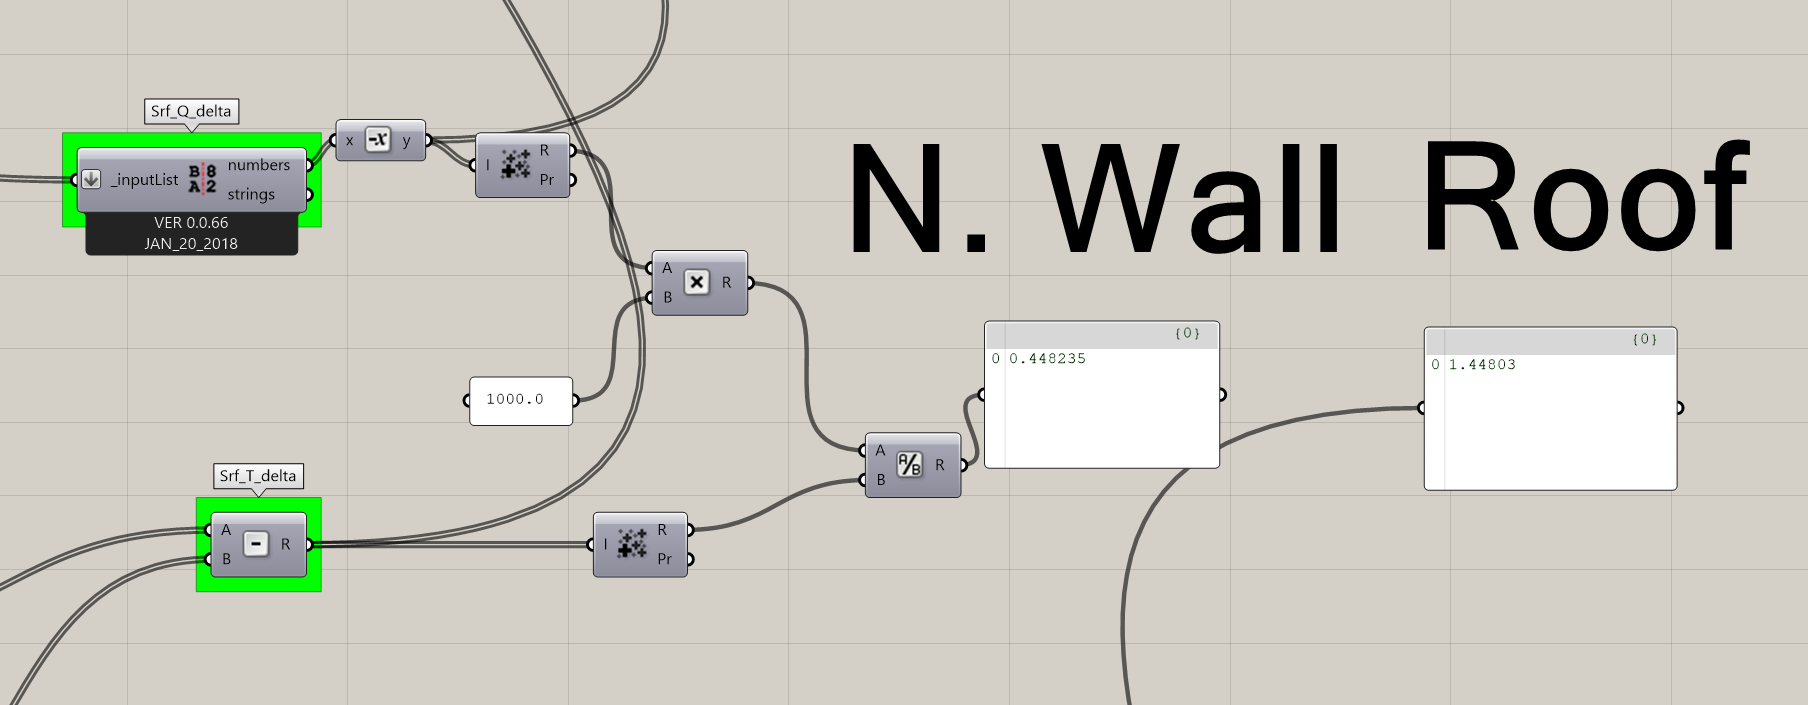
Essentially we can achieve it with this formula:
U = sum(Qsrf) / sum(deltaT)
where:
sum(Qsrf) = sum of net heat power per square cross-section area across the slab ( Q_x - Q_x+dx )
sum(deltaT) = sum of change in temperature across the slab
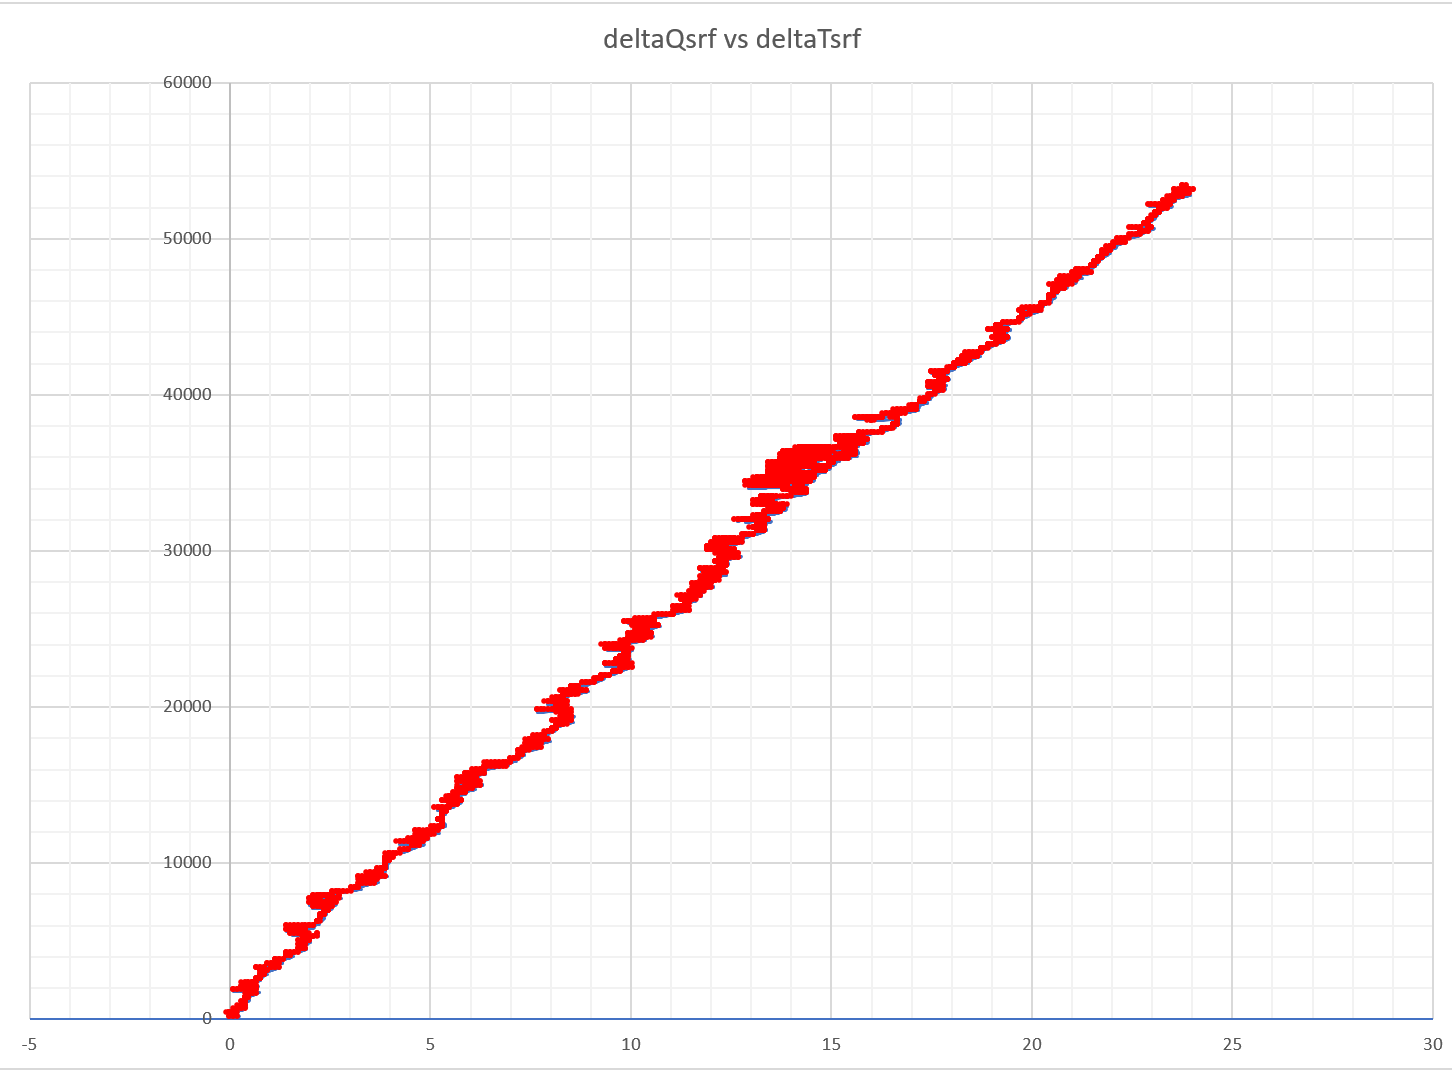
Assuming that over a long enough time period, the charging and discharging of the slab with heat energy will average or cancel out the changing net heat through the surface (and corresponding temperature change) due to changing transient conditions to provide a slope representing the conductive heat transfer through the slab. Therefore the average total change in Qsrf is our conductive heat transfer, and we can just using the steady-state equation over the sum of Qsrf and deltaT values.
The relationship between these two variables illustrated above. Essentially, the sum of the net heat power plotted over sum of the temperature change will oscillate locally and give us the red curve. The average of these values (the blue line) illustrates that change in Qsrf is linearly related to the change in temperature, and that the constant slope of this line is the U-value. By taking the net change in Qsrf, and net change in temperature over a long time period, we are effectively extracting the blue line from noisy data.
Amazing!
Could you transpose the above mentioned element of the equation in Eplus variables?
Since I have started working on two projects that require Energy simulation, and i have decided to create a spread sheet, with the ambition to have a full set of equation from the technical physics in steady state condition as per the ones you can find from the literature (Szokolay, Introduction to architectural Science)
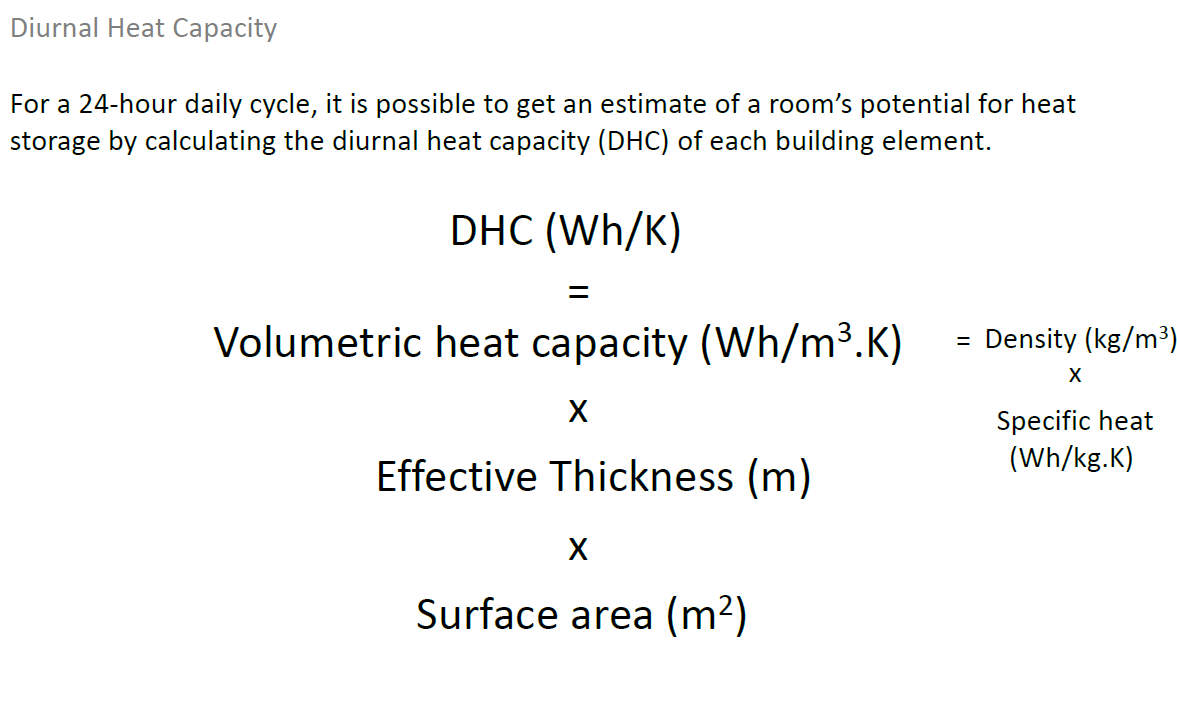
Regarding thermal storage I want to use the Diurnal Heat Capacity
In order to get the magnitude of the results provided by Eplus.
I have attached the spreedsheet. The only problem is that according to the above mentioned heat balance I am still not able to demonstrate this equivalence.heatbalancecheckZone_rev2.xlsx (237.2 KB)
Part of this effort to double check Eplus results include the check of the u value, believing that it was numerically easy to extract the U value, not from the output tables but from the Eplus results itself per each hour of the year.
Let me know if you may be interested in this spreadsheet. Actually, the steady state equations are able to predict with high accuracy the convective heat exchange due to ACH, both sensible and latent. The Diurnal Heat capacity gives me underestimated value of the Heat storage (but this is due the limitation of the formula itself, that is super simple). Conduction heat transfer in steady state is not really precise too.
Let me know if it may be of interest. I think that we have to master the results of Eplus, in such a way, in order to avoid potential pointless results.
Always wonderful to see thermodynamic equations in a post!
The time-sensitive phenomena that @SaeranVasanthakumar described with the red and blue lines is exactly the reason why my example files of energy balances typically depict balances over an entire month. At any given timestep of the calculation, the energy into the building is rarely balanced with the energy out of the building (there’s a significant amount of energy being stored or released from the mass of the building). Even when you look at the balance over a whole day (which you can do in the example I linked to by plugging in “totaledDaily” results into the monthly bar chart), you will see that you get large storage terms for each day. So, if you are trying to do this validation, I recommend taking at least a month’s worth of simulation results with an epw that has 0 solar. And, even with that, don’t expect to get exactly the same U-Value that you have entered. Again, U-Value is a “miles per gallon” type of metric. While you can get close to it by “driving” (simulating) close to “highway” (NFRC) conditions, it’s very difficult to get an exact match without controlling every input of the simulation to mimic NFRC conditions.
Update: Regarding getting the U-value from a non-steady state model. I just tested it out and the averaged out values of the deltaQsrf and deltaTsrf from two surfaces is giving me good results.
So not perfect, but good enough I think. @chris suggestion of taking out the solar data would definitely improve it. Here’s the Qsrfdelta and Tsrfdelta plotted in excel for the annual simulation I made. You can see that there is a steady line we can extract from this which is our U:
Regarding the nominal nature of CTF, I’m using the Opaque Energy Gain/Loss output from Honeybee (not sure what it translates to in EP), but I think even if it is a nominal estimate, over a long enough time period the average of all it’s max and min values should be close to the steady-state conductive heat transfer, over daily, and seasonal cycles.