I have few question about the Annual Irradiance component in LBT.
I need to evaluate the Solar Irradiance on a Tower for one Day and for a whole Year, and I have encountered some doubt after the analysis:
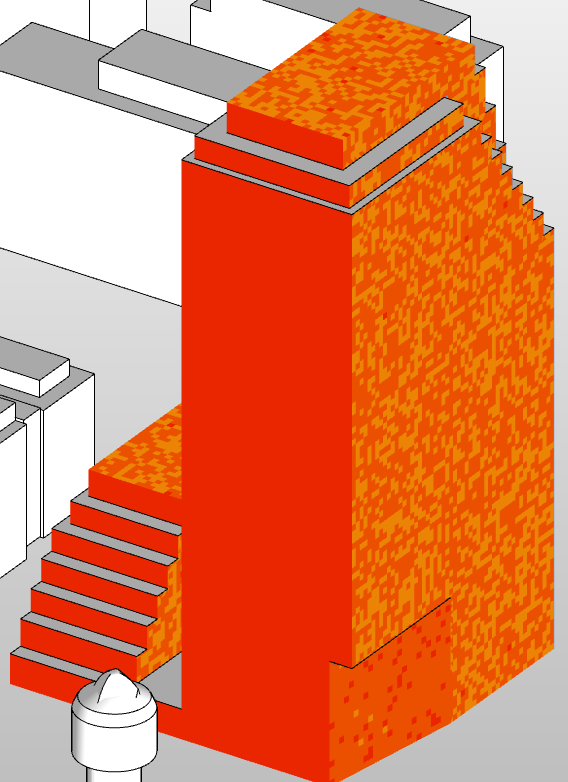
not-uniform heatmap result despite using very accurate radiance parameters. Legend step is set up for every 100w/m² and goes from 0 to 800w/m² (Sorry I forgot the Legend on the screenshots)
I know that the non-uniformity results of the grid may depend on the stochastic analysis of Radiance, but why doesn’t it happen for the south facade?I have simulated without the context.
I am especially strangers with the result on the roof. Shouldn’t the roof have the highest irradiation?
From these analyzes the south façades have the largest number of w/m² and not the roofs surfaces.
The Left image was made with rtrace, the right image with rfluxmtx.
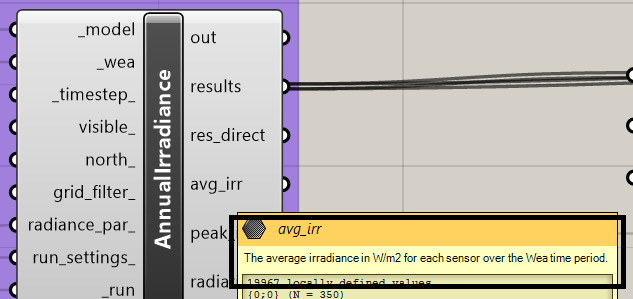
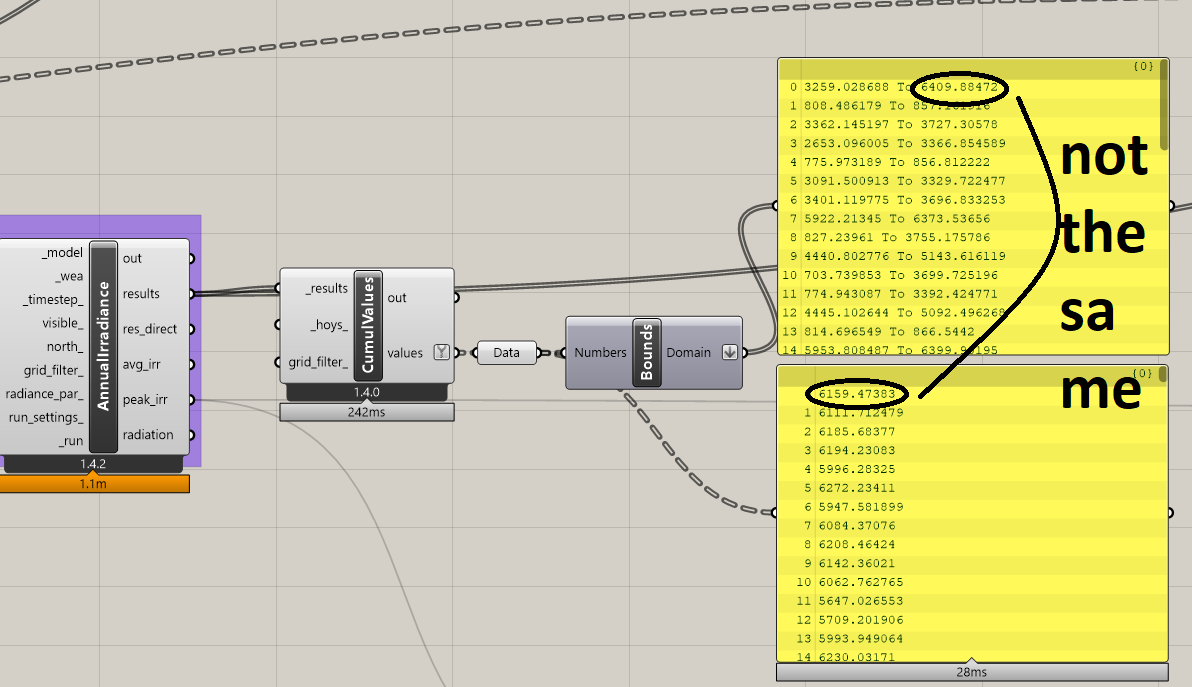
When I will read the cumulative analysed w/m² for each sensor, why I have 2 different result between the cumulative value and the High Bounds Value from the same list? The High bounds value, should not be the max cumulative value? or I am maybe wrong?
What offset distance are you using to ensure the sensor points are not perfectly coplanar with the geometry? If it’s too small (below the model tolerance), then you are going to get the model geometry interfering with the values at the sensor points.
Hello Chris,
I was interested, and tested the attached file, I found the same problematics.
I used one offset of 5cm and the model is in meters.
Any suggestion about the roof result? is also interesting to know why the roof has a lower result than, for example, the south fassade.
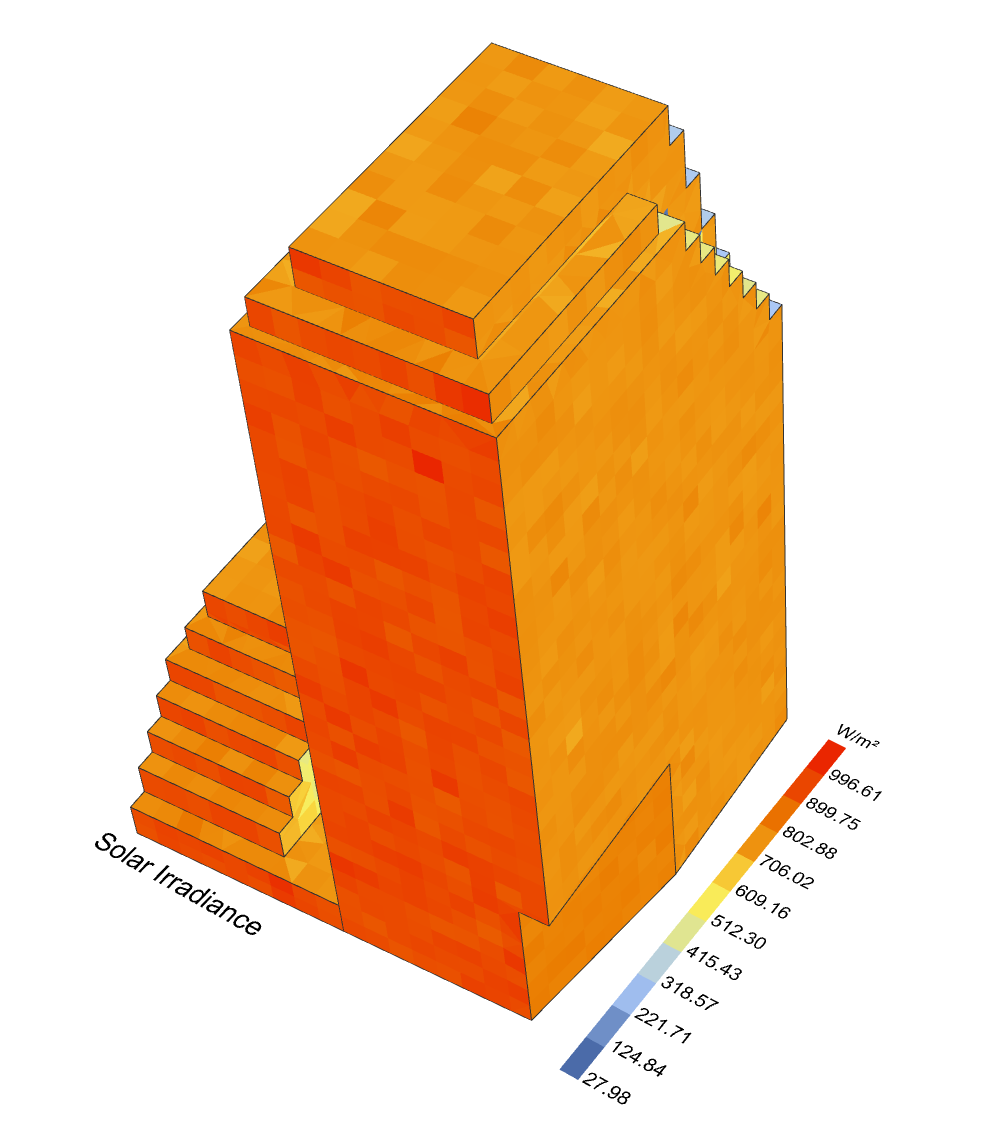
Ok, your legend wasn’t set up to be the same for all meshes. You have to flatten the meshes before you join them and flatten the irradiance data tree. Once you join everything into one mesh, things look pretty ok:
They’ll become even more ok with better radiance parameters since I only used the default ones there. And I would expect walls to have a higher peak irradiance than roofs unless you’re close to the equator studying the summer (instead of March).
I have a one more question, which unfortunately I can not understand, I hope in your knowledge on the subject.
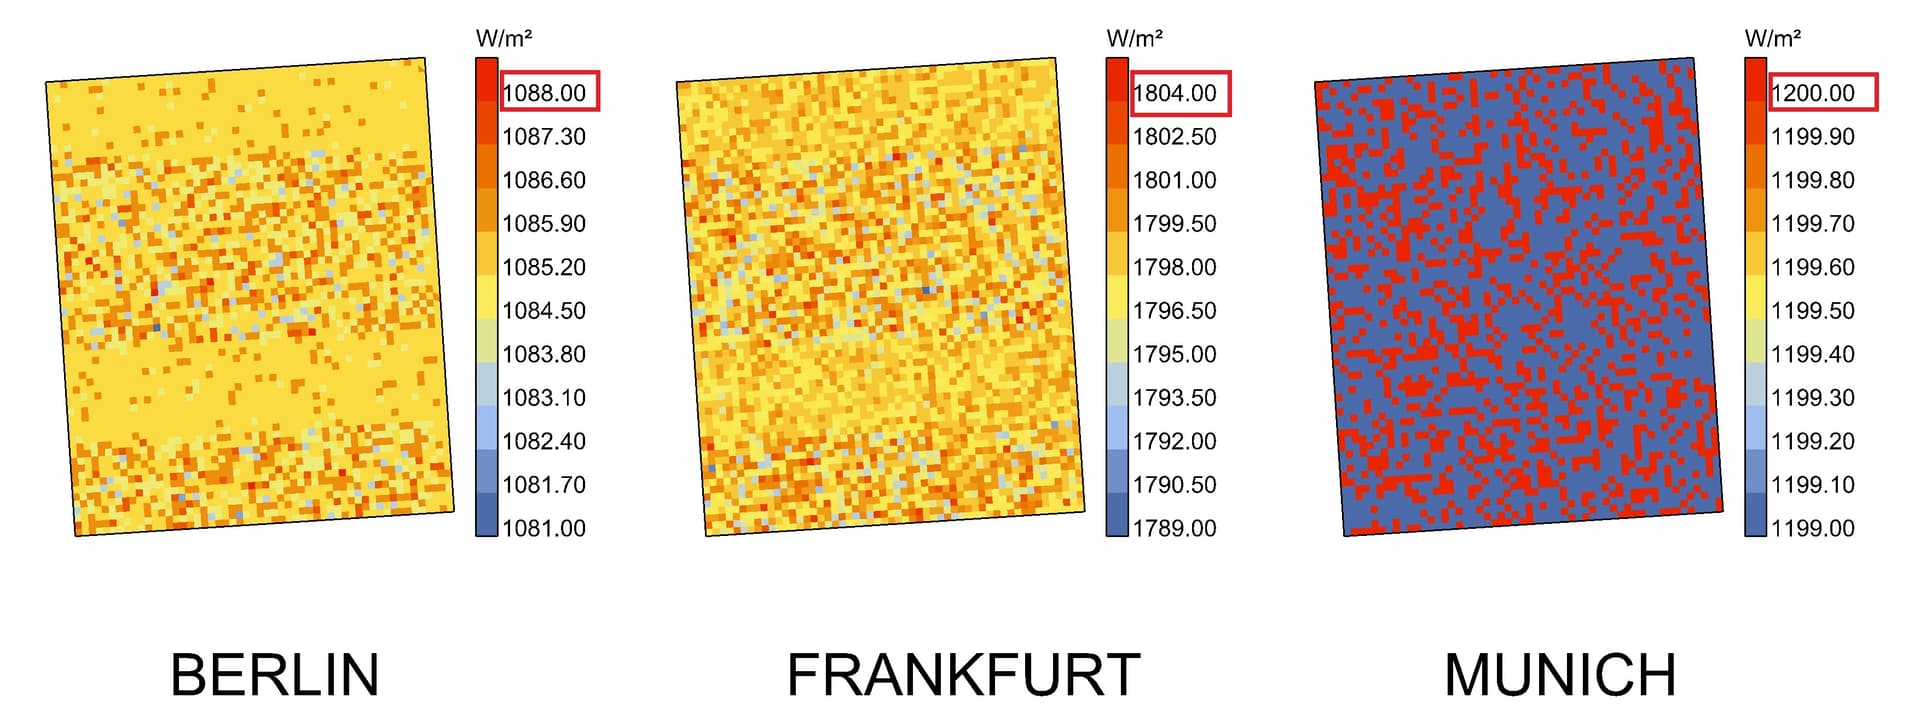
I wanted to do a test, and I analyzed the irradiance on a single surface for a single day (21 March) for 3 different German cities (one in the north, one in the center and one in the south) and the result of one of the 3 and the result surprises me.
The higher value of the cities to the north (1090 W/m² for Berlin) and south (1200 W/m² for Munich) seems to me adequate, but the result of Frankfurt, who is located between the 2 city, it seems exaggeratedly higher to me (1800 W/m²).
What can all this gap depend on? Could it be a problem related to the Wea-File? I used two other cities close to Frankfurt and the result is similar.
I checked the annual data of the global irradiance of the 3 cities and the result is appropriate.
I really don’t understand what all this gap could depend on.
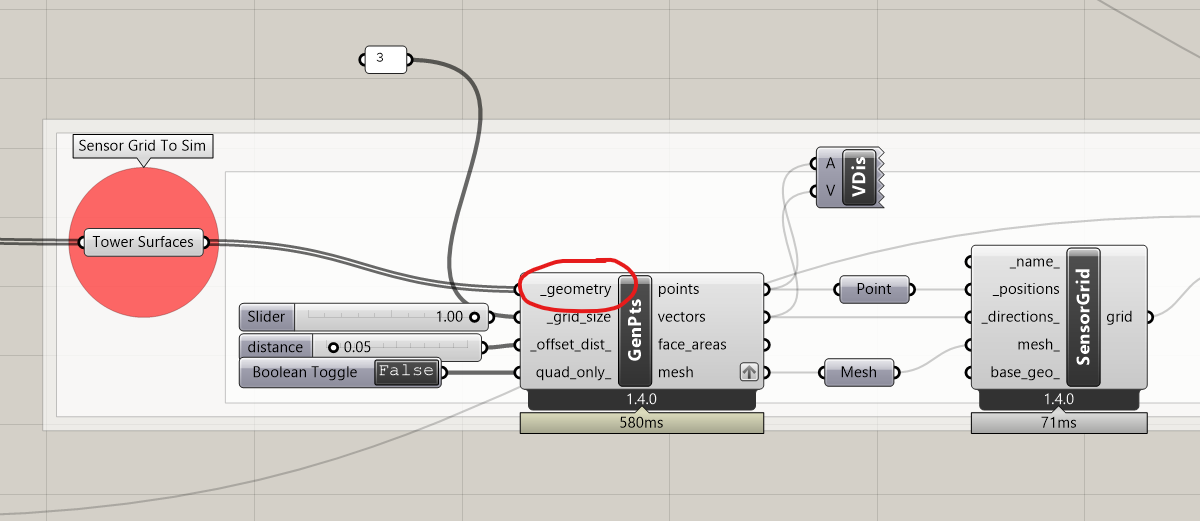
when generating Test Points for external surface irradiation, is the only way to “properly” do this by using surface/breps as the _geometry input in the GetPts component?
or is there a way to use the mesh output from the HB Visualize by Type component, i.e., to isolate the HB roofs or HB windows? when i currently do this latter method, all my test points are triangulated, most likely because the mesh _geometry inputs.
@LaFleur . Individual hours of TMY EPW files are not meant to be indicators of typical climate conditions on that hour. They’re only really meant to be indicators of climate over the whole year. My guess is that some of the German EWPs are using weather conditions from a certain historical year and the others are using a different historical year. On one year, the conditions were cloudy for that hour. On the other year, the conditions were sunny for that hour.
If you want to do an apples-to-apples comparison of clear sky conditions, you can use the Wea from Tau Clear Sky to make a Wea that uses a standard clear sky for each of those locations.