When using honeybee-3DM to generate test points, I was wondering if you knew a way to preserve the order of breps in Rhino layers so that the test points follow a consistent data structure?
Basically I’m stuck on Grasshopper because generating large number of test points saturates, although the data tree structure is consistent, while when using honeybee-3DM I don’t have GH limitations but I can’t have consistent data structure.
Hi @OlivierDambron, Can you name the breps/sensor-grids and re-structure them back when reading the results? I don’t know if we export the name for each Brep but that’s something that I imagine is straightforward to implement.
Thanks for sharing your thoughts.
For the purpose of testing, please find here a small sample file. The logic will serve to process urban areas nearly 50 times larger. I’ll try to clarify as much as possible:
Intention:
The data structure I’m trying to preserve on Grasshopper is the following:
Each property can hold 1 or more buildings.
Each building can have 1 or more test surface
I’m trying to compute Direct Sun Hours on the facades of buildings and to be able to query results for a given Property by looking for a path.
Options 1 :
I’ve managed to do write and run a medium size simulation on Grasshopper.
I’ve decided to flatten all test points to generate only 1 sensor grid, read the results and match their data tree structure back. This saves overhead time (which can be really huge) linked to the decomposition of all grids into subgrids, and facilitates the settings for optimal sensor count (nb of sensors / nb of CPU).
The problems comes with large scale simulations, Gh becomes the bottleneck with a lot of waiting time between clicks to generate test points. The definition becomes hard to handle.
Option 2 :
Using Honeybee-3DM could help bypass Grasshopper limitations.
@devang, following @mostapha’s strategy and @Mathiassn’s logic, would it be possible for honeybee3DM to generate only 1 sensor grid for all test surfaces within a single layer?
And generate a list (csv or else) of number of points generated per surface?
That way I can restructure the results accordingly in grasshopper.
I am going to only focus on the honeybee-3dm part here.
You need grids per layer. If a layer has 5 surfaces, there will be 5 grids, but you want those 5 grids separated from other layers. So it would be
Layer1 = grid1, grid2, …
Layer2 = grid1, grid2,…
The information on the grids can be csv files or something else.
I created support for what you want to do here on a separate branch on my fork of honeybee-3dm. Please follow the following steps to get a local version of honeybee-3dm with modified behaviour.
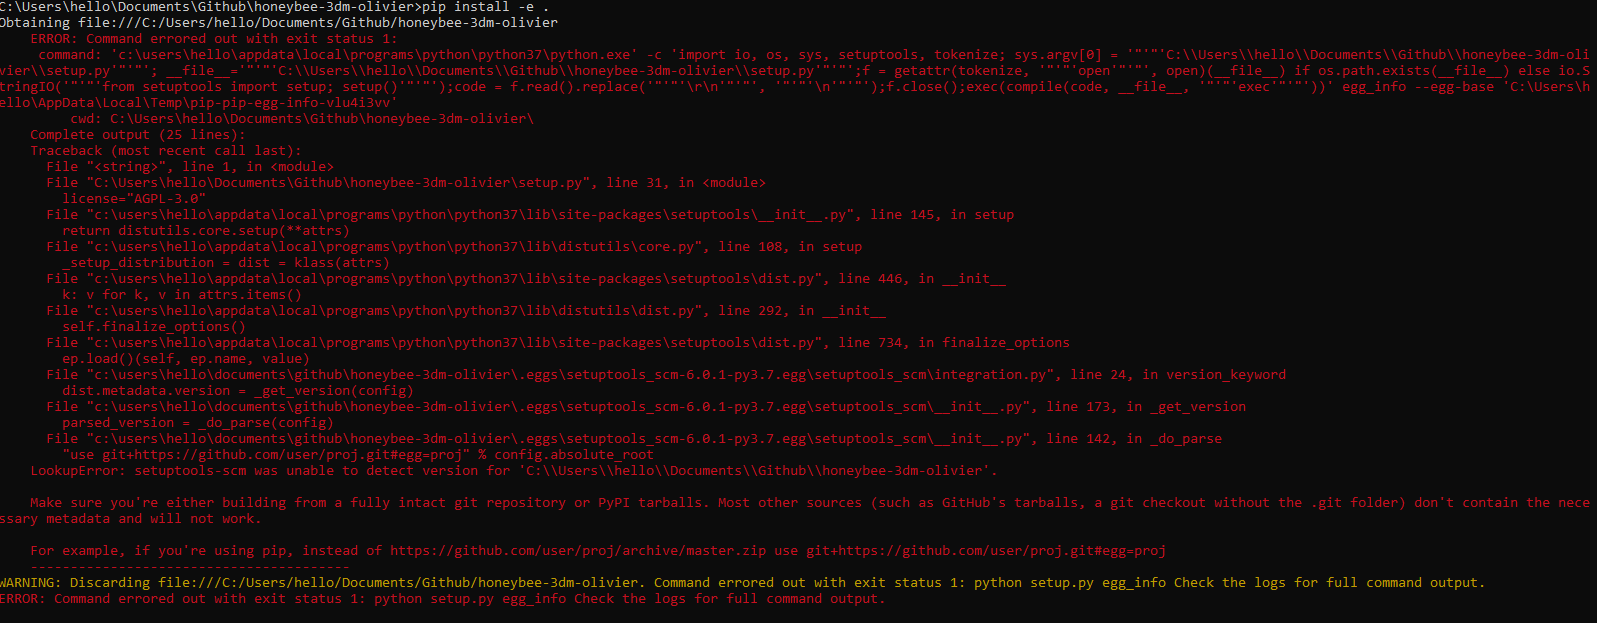
Fire up command prompt and go into the folder from step-1
run this command, pip install -e . This will install a local copy of honeybee-3dm from step-1. Let’s call this honeybee-3dm-olivier
Now you can navigate to any folder on your system to take honeybee-3dm-olivier for a spin.
Honeybee-3dm-olivier has following changes;
One sensor-grid per layer
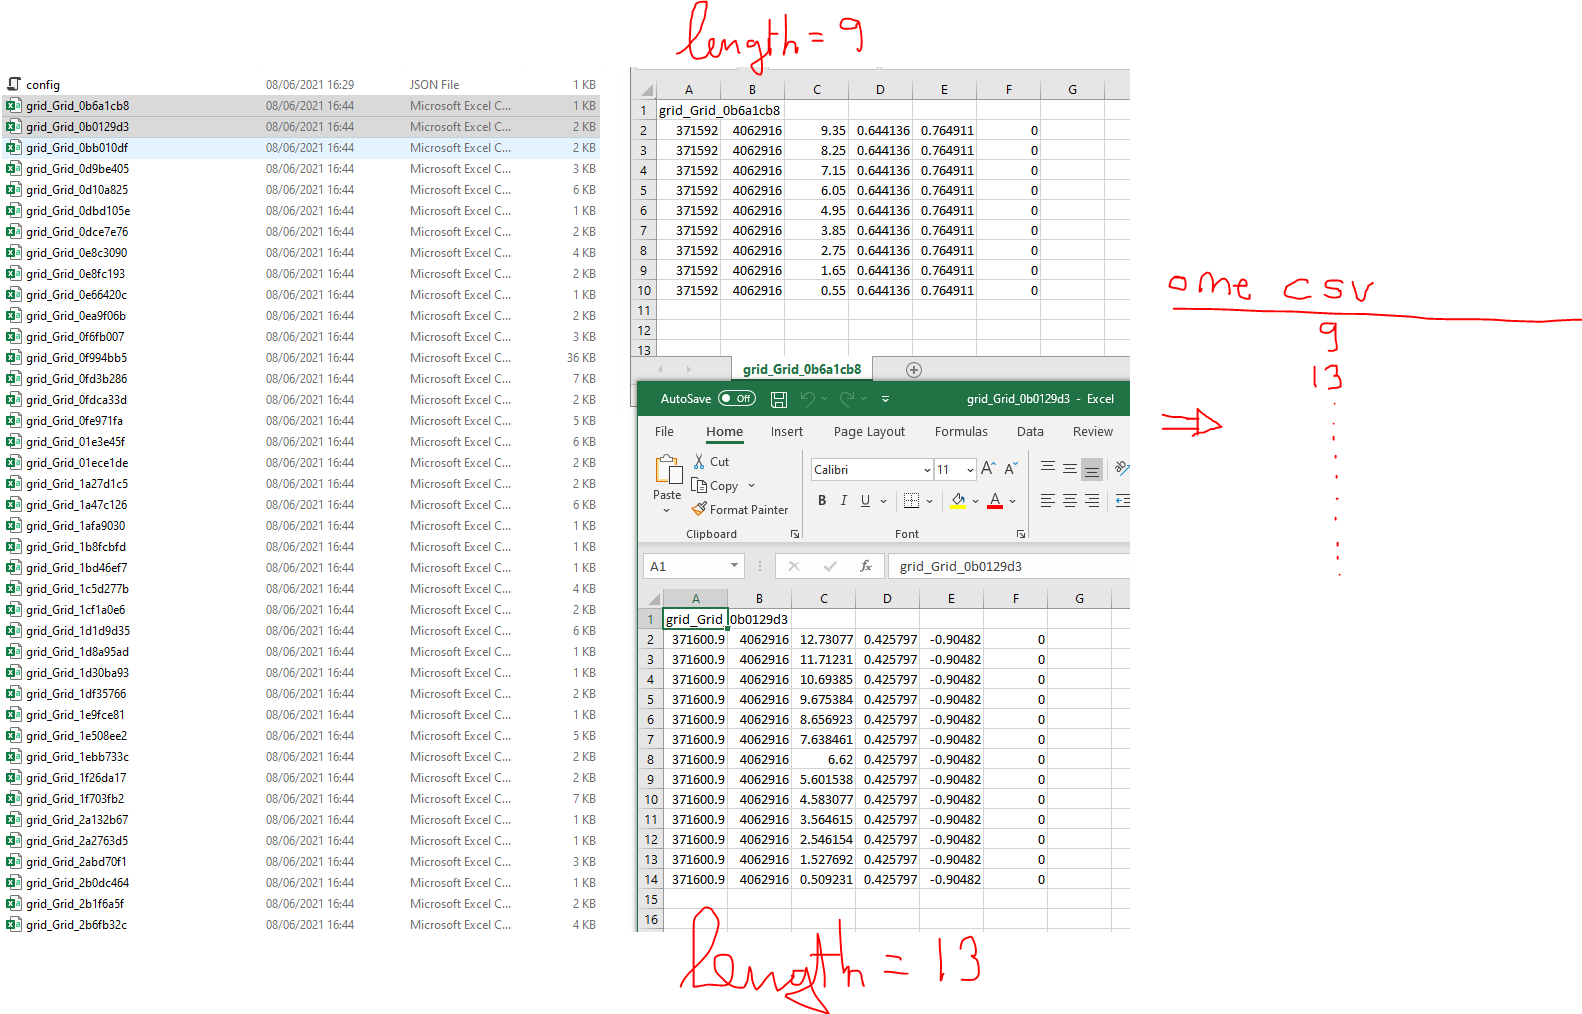
csv output with points and directions per object on a layer. This csv has six columns. The first three are X,Y, Z cordinates of a point and the rest of the three are X,Y, and Z components of the direction at that point.
hey @OlivierDambron, I updated olivier branch of my fork. If you keep grid objects on separate layers, you’ll get one sensorgrid per layer in hbjson (This was already implemented in the last iteration), and one csv file with three columns; Layer name, Object name, length of sensors in the object.