I’m attempting to replicate the annual Ladybug Radiation Analysis results with the Honeybee Radiation Analysis methodology…however I’m struggling to produce an annual result with the HB route. My end goal is to be able to experiment with transparent shading features on a more complex scale, which I understand the LB radiation analysis cannot analyze, hence the HB route.
I tried using the HB “read all hourly results” component and doing a Flip/Mass Addition, but a) very computer processor intensive and b) resulted in an error that said the number of point values did not match the number of faces, even though I believe the number did match. The current HB components utilized in the uploaded files are just the “ready hourly results” component.
any assistance would be great! thanks!
HB Radiation Analysis Test.3dm (106.0 KB)
HB Radiation Analysis Test.gh (555.5 KB)
Hi @josh.greenfield,
Daylight Simulation and visualization works fine on my machine without any change.
HB Radiation Analysis Test_omr.gh (563.7 KB)
thanks for taking a look Omidm…in the baseline file I uploaded, the Honeybee Radiation Analysis methodology is currently utilizing the single hour methodology, which works fine as you noted…however I want to visualize the ANNUAL results using the HB Radiation Analysis method, which I currently cannot figure out how too.
@josh.greenfield,
Apologize, I ignored that.
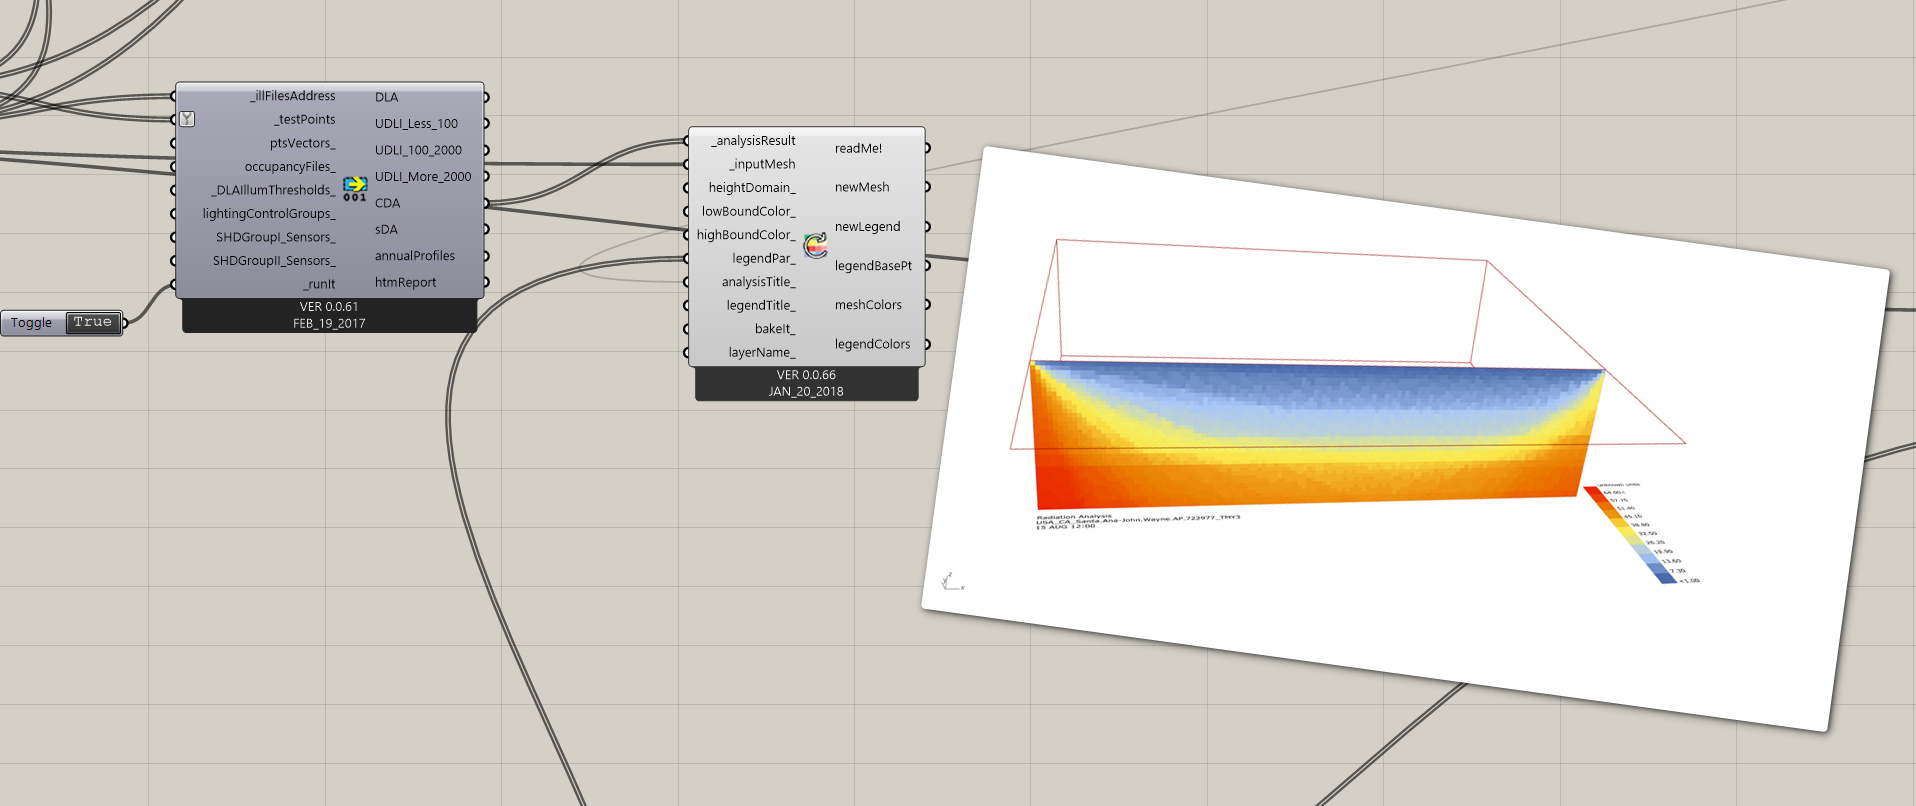
Here is the annual result:
HB Radiation Analysis Test_omr01.gh (572.6 KB)
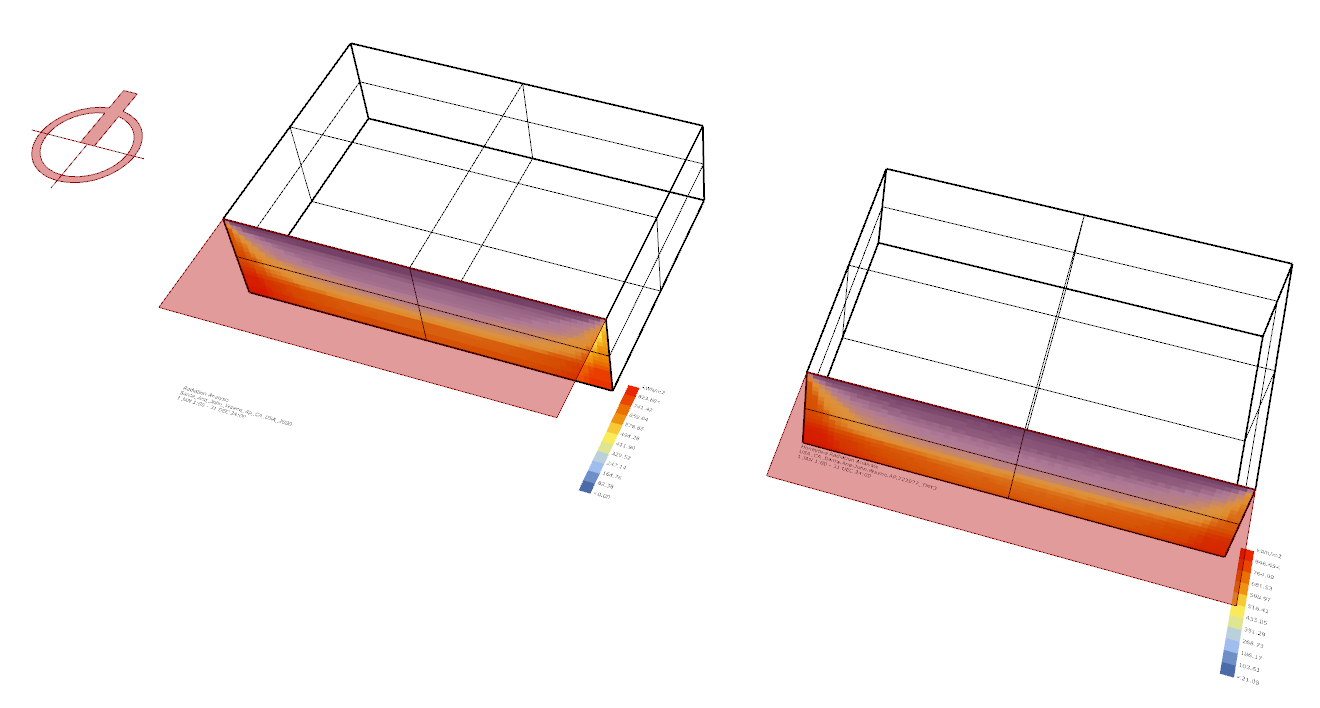
thanks again Omidm for taking a look…so my next question…the annual output values for honeybee “CDA” are in the range of <61 whereas the annual output values for the Ladybug method are <860 kwh/m2…any thoughts on why the big difference??
so I went back to my initial attempt of using the HB “read all hourly results” component and doing a Flip/Mass Addition, despite it being very computer processor intensive and still resulting in an warning that said the number of point values did not match the number of faces, even though I believe the number did match…once I flattened the incoming data source the mesh visualization worked. The Ladybug outputs peak at around 823 w/m2 whereas the HB outputs peak at around 846 w/m2…I know they are different methodologies and i’m assuming different algorithms, but do I have any settings mismatched that would get the values to be a bit more similar?
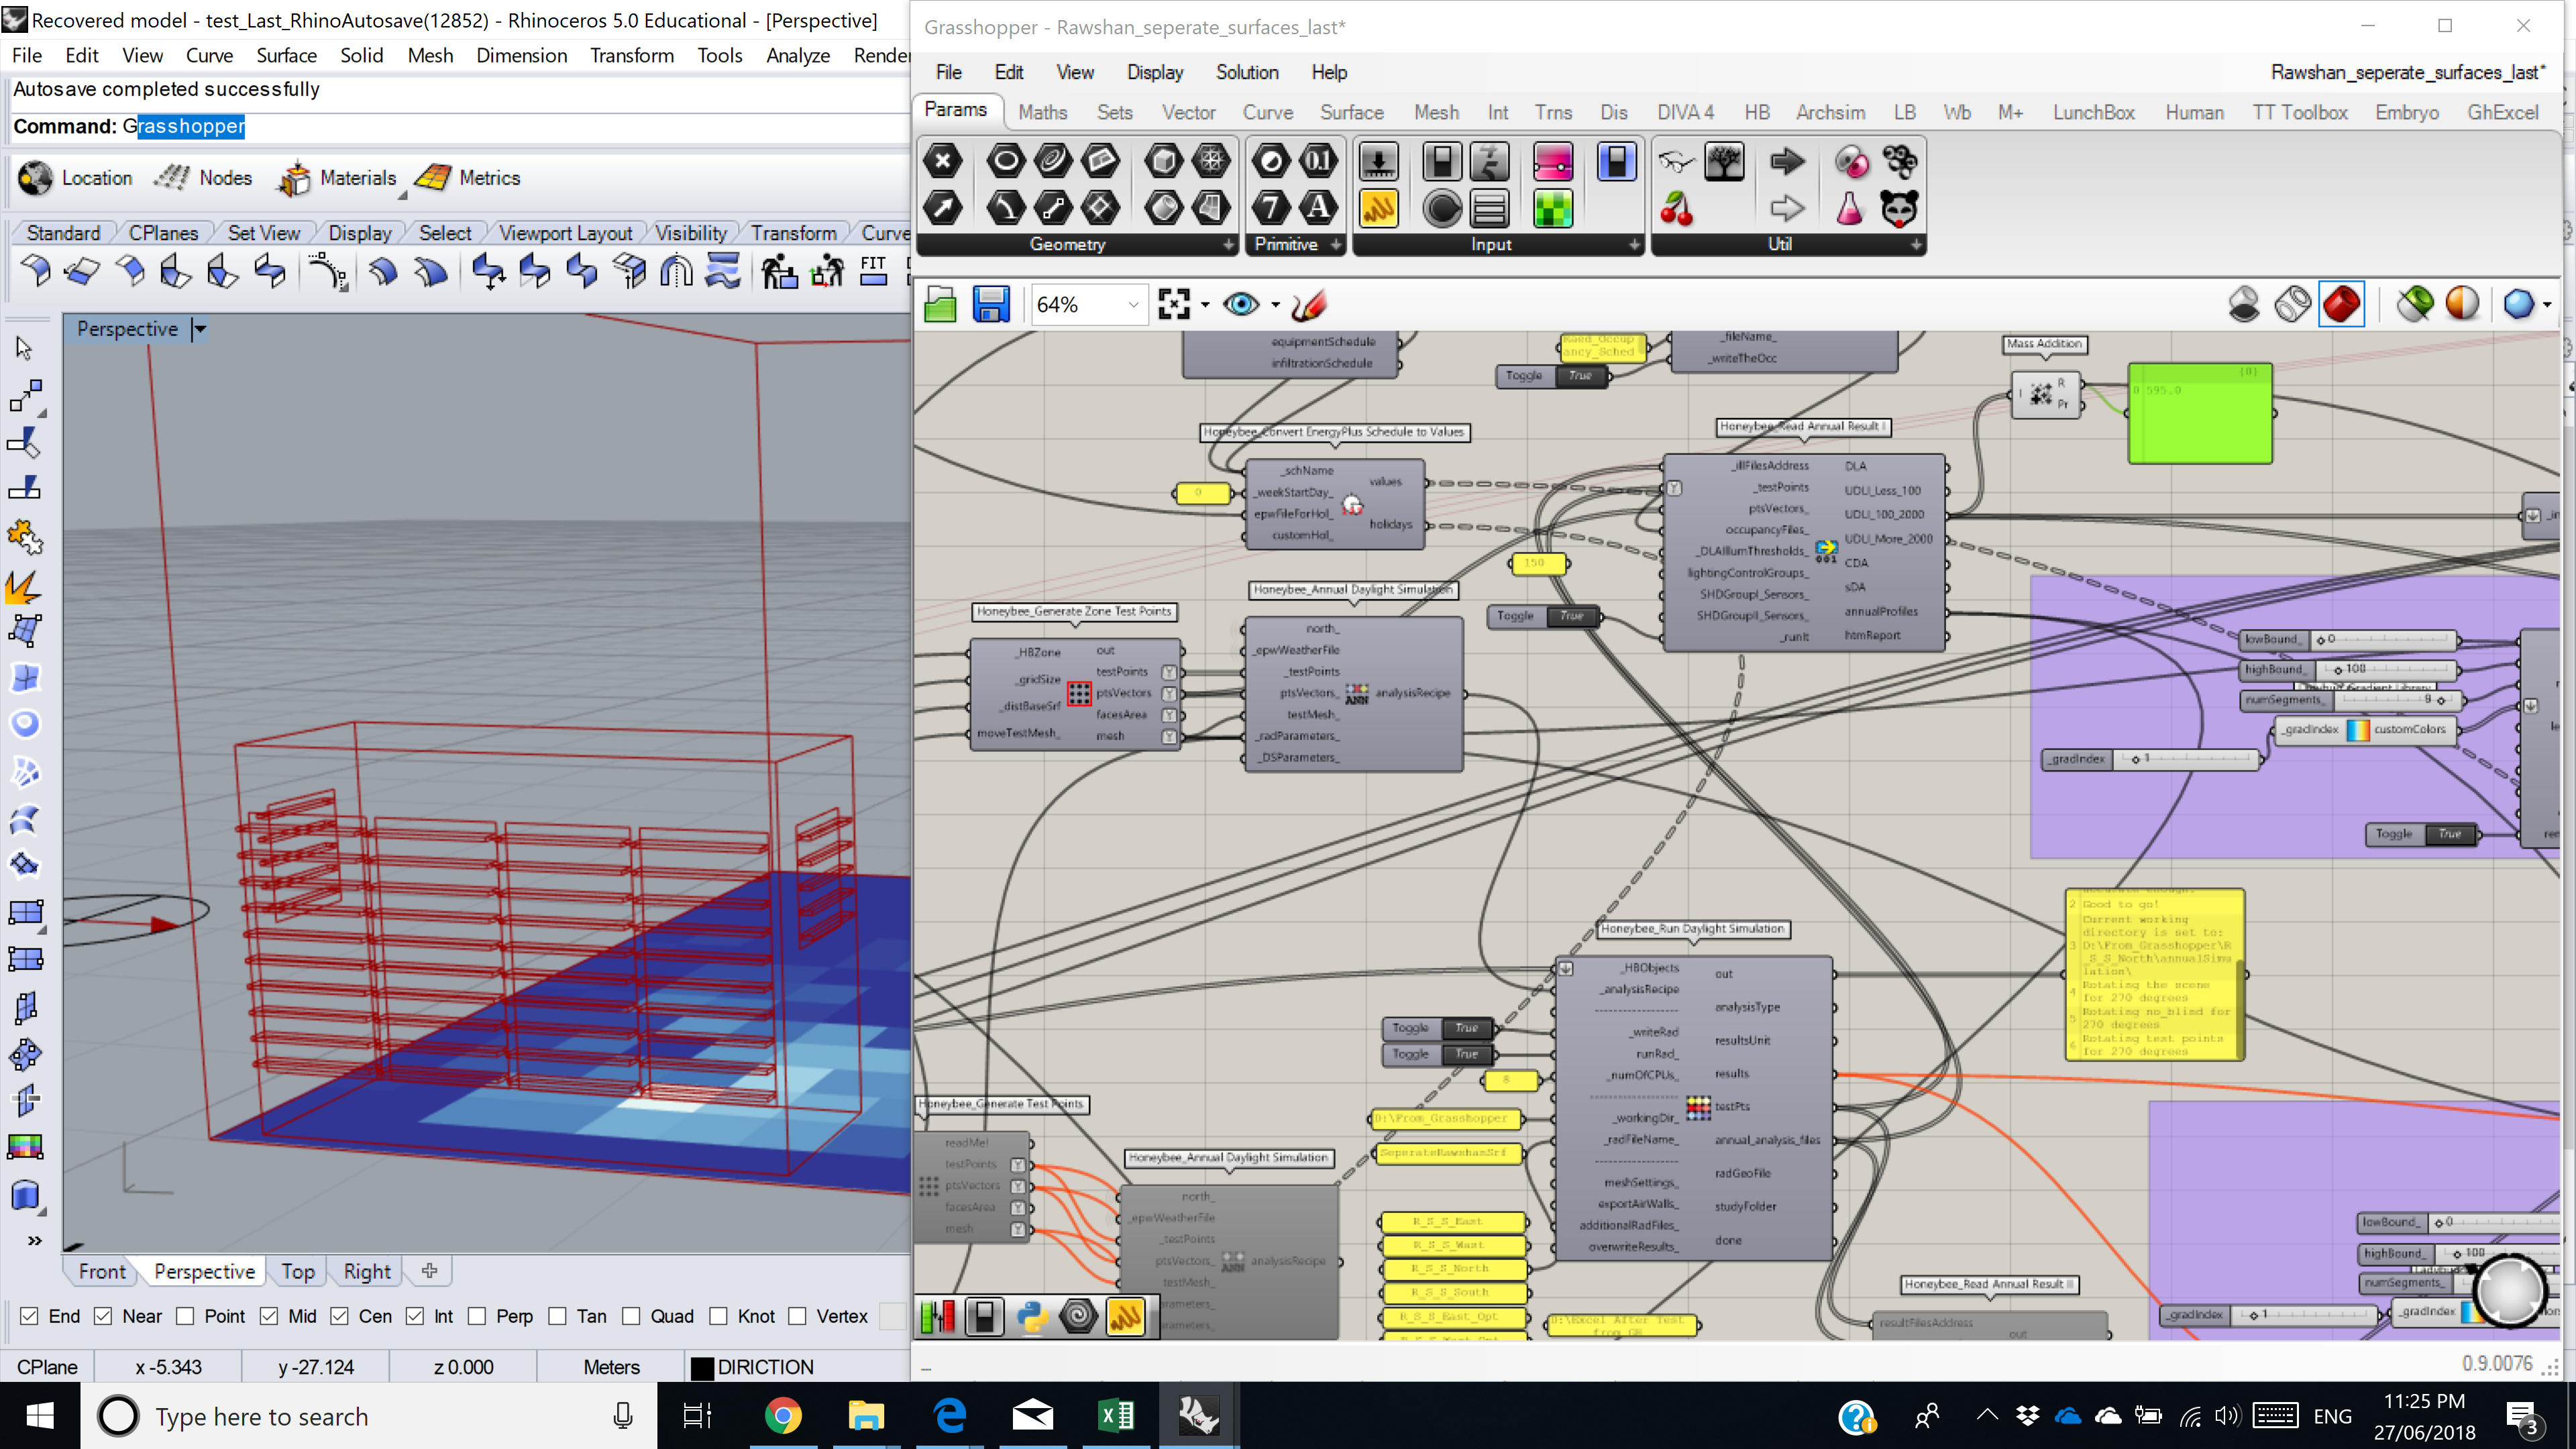
also…dumb question…how do you get the Rhino preview to show up as an “angled postcard”-like view in your grasshopper screenshot??
thanks!
HB Radiation Analysis Test.3dm (68.0 KB)
HB Radiation Analysis Test.gh (543.2 KB)
@josh.greenfield,
As far as you know, and it is better to keep in mind an important difference that Ladybug radiation analysis just evaluates incident radiation. But in Honeybee, like annualDaylightSimulation considers the type of surfaces, materials, and Interreflection and etc.
Export Grasshopper canvas as image keyboard shortcut is Ctrl+Shift+Q
Hello @OmidmRashidi
I read your discussions which were helpful to me. I just got a couple of questions! In my case, I would calculate daylight that was perforated by blinds inside a room during a year using Honeybee_Run Daylight Simulation with analysis recipe component is HB_Annual Daylight Simulation, and HB_Read Annual Result I. So, I haven’t got a result that mentions how much daylight in each hour during a day, month and year! The blinds or solar screen have variables of thickness to manipulate with perforation. If I directed the room toward East, I would know how much daylight during an hour, a day and a month after manipulating with perforations.
Any ideas to get these result?
Thanks in advance,
Raed
Hi @rsalelwani,
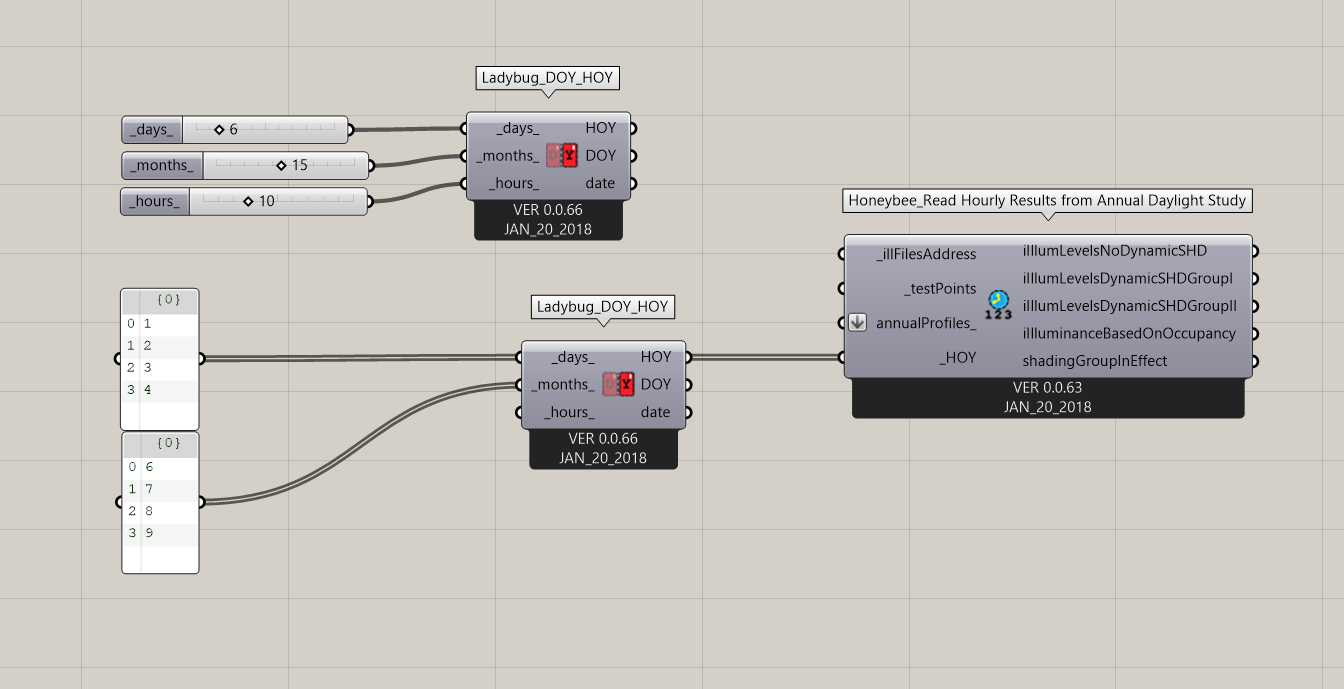
To Read\get the illuminance values in the specific hour(s) of the year from Annual daylight study I would use Honeybee_Read Hourly Results from Annual Daylight Study and Ladybug_DOY_HOY components.