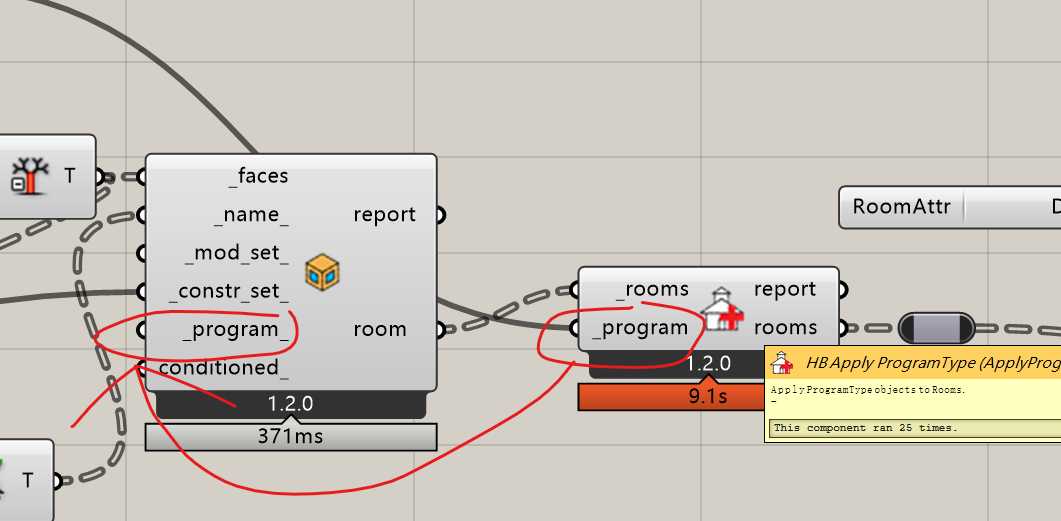
Seems using the Apply ProgramType component will be the same. I suppose is it the underlying data processing method of the new ladybug tools that leads to this issue? @MingboPeng@chris
I think that this is not necessarily an issue with the individual components that are taking long to run but the fact that you are gradually ramping up the data stored in memory for the Rhino/Grasshopper instance as you iterate through options. So, after you get above certain limits, things just get really slow (it’s possible that Grasshopper is writing the stuff that can’t fit in memory to the hard drive or something like that). I remember that, for the parametric energy models that I would run with Legacy, I was never able to run more than ~1,000 models before the memory of the Grasshopper instance would hit some limit and Rhino would crash.
I was often able to get around the limitation by just writing out all of the simulation files, restarting Rhino/Grasshopper, and then running the simulations in another Grasshopper definition. What type of simulation are you running? And how much data are you loading in order to get the results for Colibri?
At the end of the day, I think we’ll probably have to realize that generating 1,000 models and simulating them is a tall order for any desktop application. It’s pretty impressive that Grasshopper lets us do as much as we currently are able to do without the memory blowing up. But that’s why we are developing the Pollination Could service. Any parametric study with more than 1,000 options really should be run with the aid of cloud resources. It’s just a big burden to put on one machine.
Thank you @chris ! I use this model to create training samples for ML predictor, so the workflow is to build the models first and then run these files parallel on a 96 core machine. I had run this workflow through legacy LH several times (the above-mentioned issue is about the legacy one) successfully.
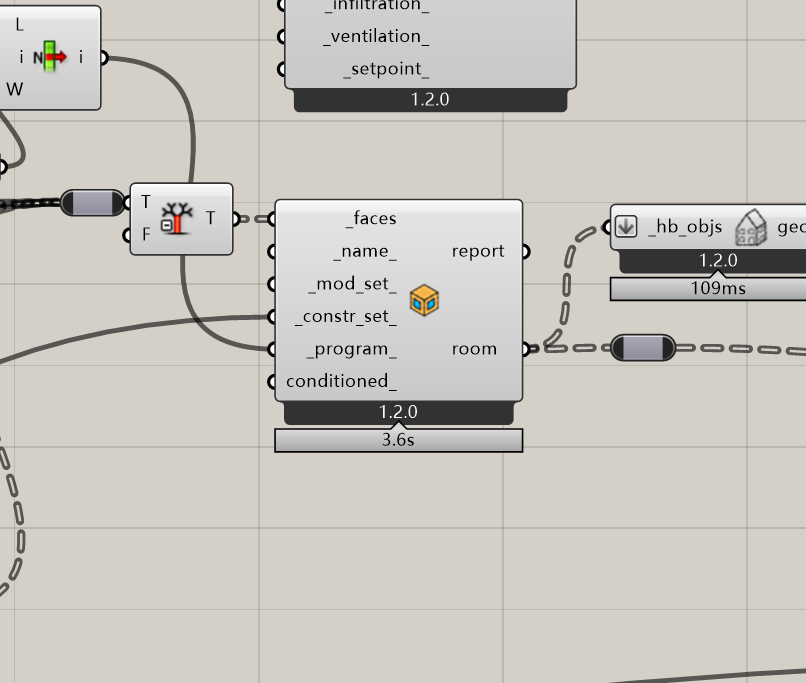
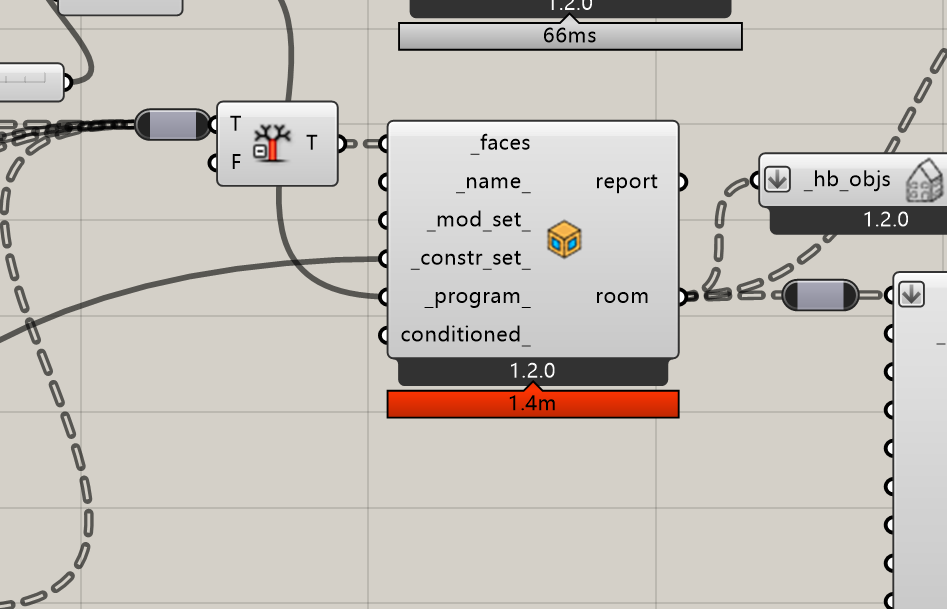
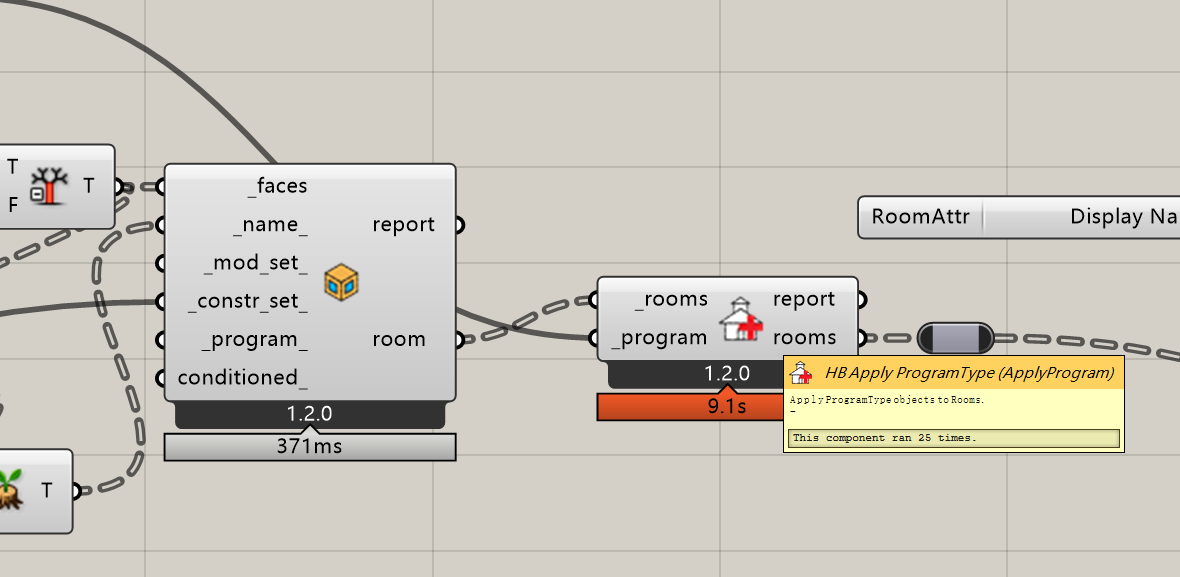
The model is just 25 rooms built through grasshopper, like below, and the file is only 117kb. And seems not much RAM usage. That is why I suppose the time increase is more like @MingboPeng 's description in the above mentioned issue last year, that after hundreds of simulations, the script just run through every room it created in history, the time spent is on CPU…
One place that could potentially save some RAM and compute time is: assigning the zone program at the beginning when you creating the zones, so that you don’t duplicate all data twice in GH.
The script in the first post is indeed assigning the program at the beginning…And I notice that, if I only close the grasshopper file and reopen it, the time will still remain very long. I must close and reopen rhino, to ensure the short computing time.
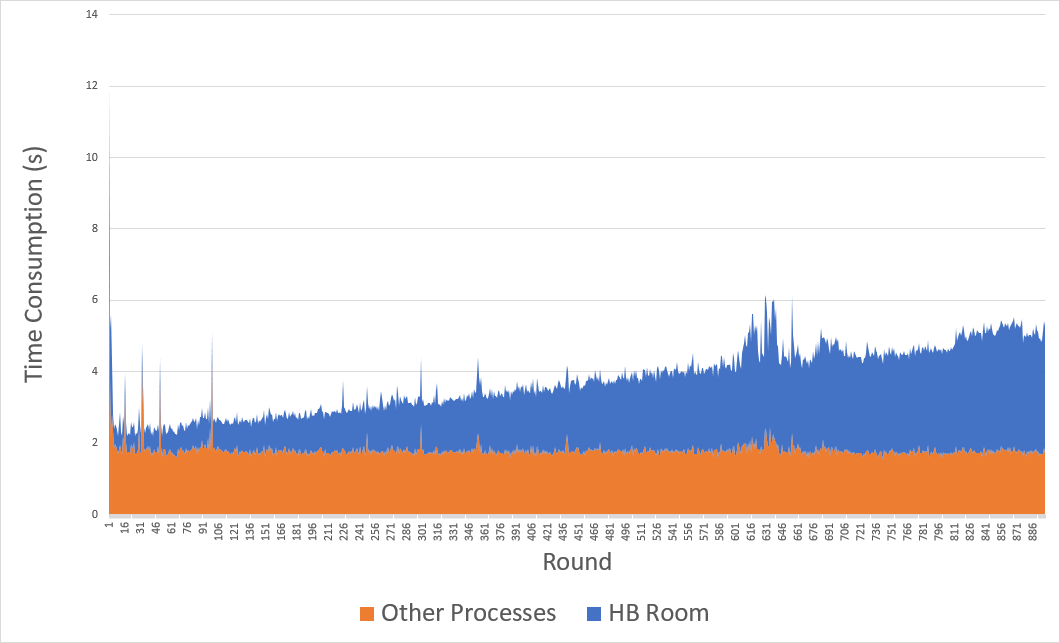
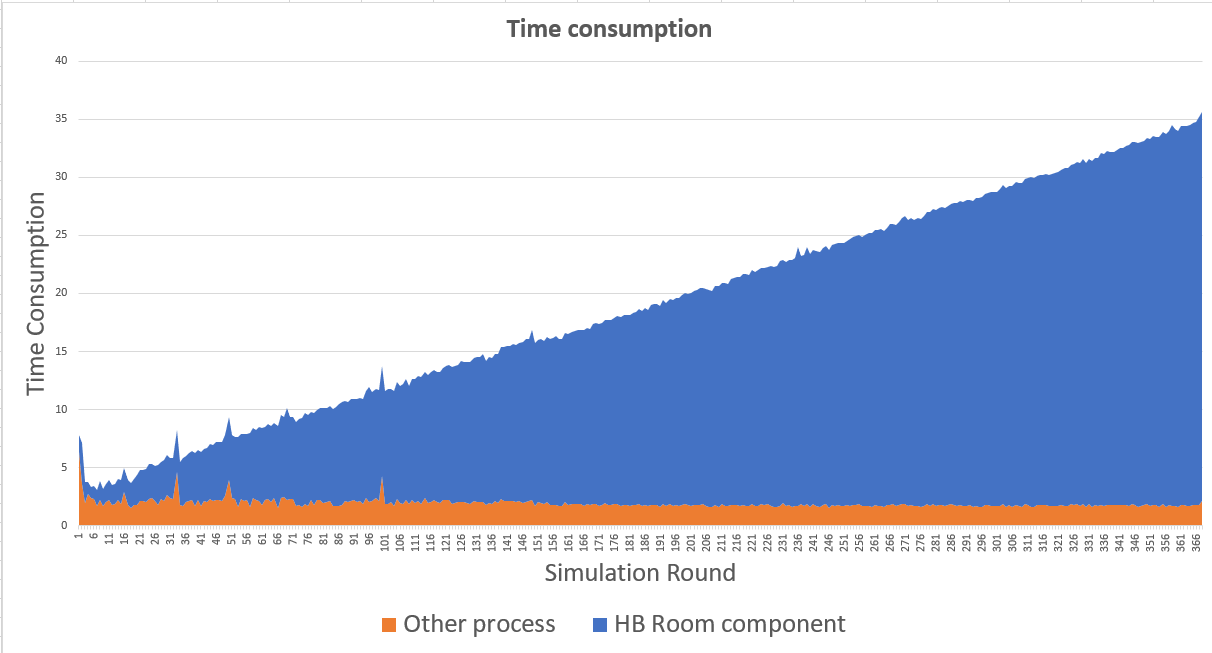
The extracted time consumption of HB Room and other process is below @chris . As the iteration goes, the HB Room component’s running time increase linear, while other HB components stays the same short time.
Maybe you can just write the OSM/E+ without simulating them. After that you can simulate them, outside Rhino/GH, as a batch and then load the results into GH?
Just thinking …
-A.
EDIT:This problem is true only for Rhino 7. On Rhino 6, the memory increase is much slower.
@chris, thanks for your answer!
I have a similar issue to @miraclema:
I’m running optimization with LB 1.1.0 Incident Radiation and Direct Sun Hours.
After around 1000 iterations, the optimization will crash due to my 32GB of memory being full.
While running the optimization, I can see the memory usage increasing linearly.
When running the same file without the LB simulations, memory usage remains stable.
In other words, it’s no problem to generate thousands of parametric geometries: it’s the simulations that use memory and, for some reason, don’t clear it.
Is there a way to stop this increasing memory usage?
I suspect that this increase would even crash a cloud server eventually, assuming that computational resources are limited .)
Our two situations are so different. I switched the script to version 7, and got the amazing time consumption, incredibly fast! @chris@MingboPeng And I also notice that the RAM stays nearly the same as version 6 and no increase (may because I only create the .osw files without simulating them). I can’t imagine the underlying mechanism so far.
On of the changes that has helped me in the past is to avoid datatrees whenever possible. Have you tried to flatten the rooms in program component? I remember there was a lengthy discussion about the inefficiencies of GHPython component and this was one of those.
@piac should be able to provide more insight to the problem as he has resolved most of them. I’m not sure if trying to compile the components can improve the performance in such cases.
I have recently been running 2000-3000 simulations in a batch via colibri iterator and I have not observed any time increase during the simulations, they always take similar amount of time (40-70 seconds).
I have also divided the batches into parts (so I am able to use computer freely) and it generally takes the same time summed up as one big chunk.
Hi! I don’t know of any particular problem regarding datatrees. Generally, but this is true in general for all of Grasshopper 1, data is slightly faster to be served to components in “bundled” items, rather than single instances. For example, one mesh with 100’000 faces rather than 100’000 meshes with single faces.
I’d be interested in hearing about the 6-vs-7 issues, if they can be reproduced with a simple setup. I cannot manage to reproduce in setups with many components.
I realized that I should qualify what I said about Pollination being a solution since it’s not really going to be a silver bullet and it’s more like it will be one of many ways to ameliorate this type of RAM situation. So maybe it’s more helpful to list these methods and then say which one Pollination is using:
Clearly, switching from Rhino 6 to Rhino 7 seems to help, possibly because there is some better “garbage collection” of data that’s not needed anymore from the memory (this is one that @piac or David Rutten would know better about).
Generally speaking, Honeybee-Radiance simulations are designed in a way that’s much more scale-able than the Ladybug direct sun or radiation simulations. This is because Honeybee offloads the ray-tracing calculation to Radiance (outside of Rhino/Grasshopper) rather than relying on Rhino’s geometry engine to do the ray-tracing. Also, many of the honeybee recipes don’t necessarily load all of the hour-by-hour results into Grasshopper’s memory (like the ladybug components). So, while the Ladybug direct sun component is nice for small studies where you want some real-time results, we recommend using the Honeybee-Radiance recipes for large studies of parametric design spaces. So this is my recommendation to you, @thomas.wortmann.
Perhaps even more impactful than the question of how the simulation is run is the question of whether it’s run at all since, for certain studies, a lot of the memory is eaten up loading results. This might not have been the case for you, @miraclema , since it sounds like writing the HBJSON files was the most intensive part of your script. But, as I said above, only writing out the simulation files in one definition and simulating them in another often helped me.
There are many ways that you can organize your Grasshopper definitions to use less memory with each iteration. As you saw in your example, @miraclema , the “serialization process” seems to be of the most memory-intense types of operations that the components perform. This means that the initial creation of Honeybee objects from Rhino geometry and the writing of Honeybee objects to HBJSON/OSM format will probably use more memory than a component that’s simply editing a property of a honeybee object. So @MingboPeng 's suggestion will probably help since it means you are not running the “HB Room” component to create the honeybee objects from Rhino geometry for every single design option that you export.
Pollination ameliorates this situation by having number 2 and 3 “baked into” its workflows. Depending on the type of parametric model you are building, it may also be able to help with number 4 in that we’ll have functions for parametrically generating options from a one or a few base models that is uploaded.
 That is why I suppose the time increase is more like
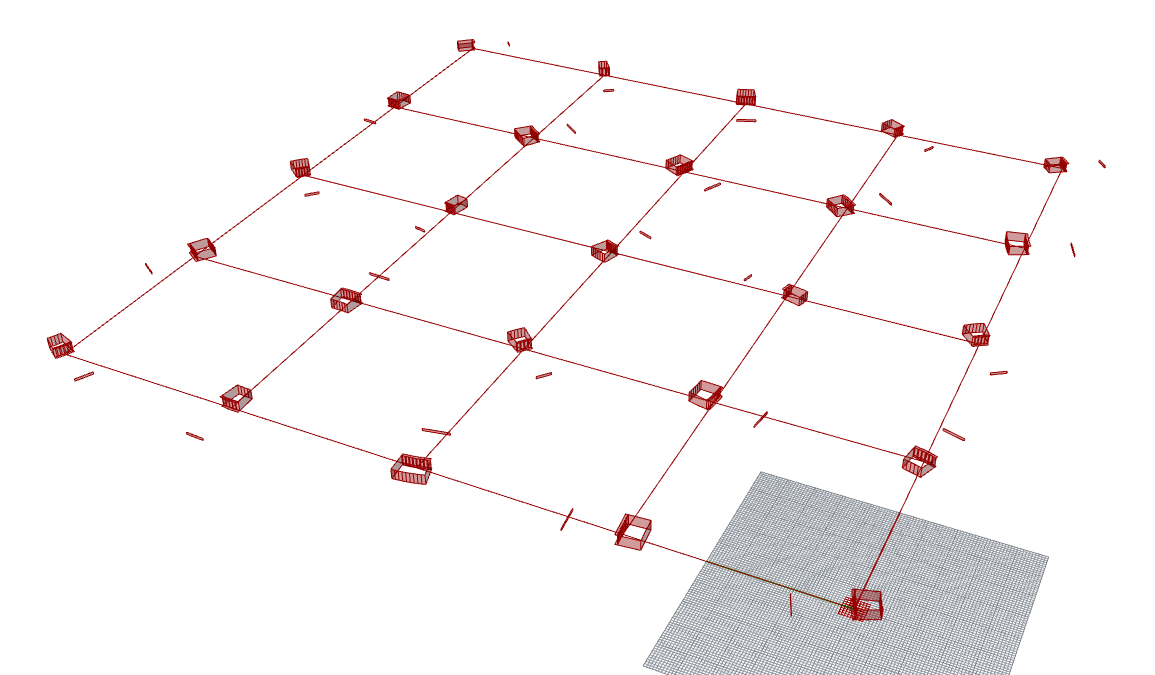

 .)
.)