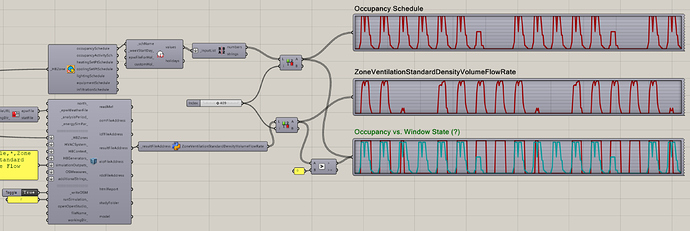
I am trying to understand how Honeybee models natural ventilation through the SetEPAirflow component. Specifically, I would like to know the time frames during which a window was simulated to be open.
I have tried doing this by requesting the output Zone Ventilation Current Density Volume Flow Rate:
My questions are
- Can I assume that every time the
Zone Ventilation Current Density Volume Flow Rateis above 0, EnergyPlus is modelling the windows to be open? - If so, does the above graph mean that the windows are always open during occupancy? This would seem unrealistic.
- It looks like the ventilation flow rate correlates with the occupancy - why is this the case?
- It also looks like the outputs are shifted by 3 days, i.e. the the time frames of weekends seem to occur at different times when comparing the occupancy schedule and ventilation output. Have I made a mistake?
WindowStates.gh (576.1 KB)
