Hello,
I am trying to model outdoor comfort using vegetation, grass and trees, using Honeybee Legacy. I got very useful information from the example files available in Hydra posts as Trees in Outdoor Thermal Comfort and Green Roof in Energy model and from all the information and files available here Outdoor comfort UTCI microclimat map || Vegetation limitations. Thank you all for these resources.
The shading effect and MRT blockage of trees is straightforward. Also the use of grass reduces consistently the ground surface temperature. Nevertheless, I have inconsistent results for the UTCI calculation. The UTCI values are higher above the portion of ground with grass than above the ground with asphalt (I use the word grass to define the area with lower surface temperatures rather than a ground with specific characteristics). Hope someone can help to understand the issue and suggest how it can be fixed.
I show some images and the GH and epw files are attached.
The model is simple, three buildings surrounding the paved area. The grey area is asphalt and the green area is grass.
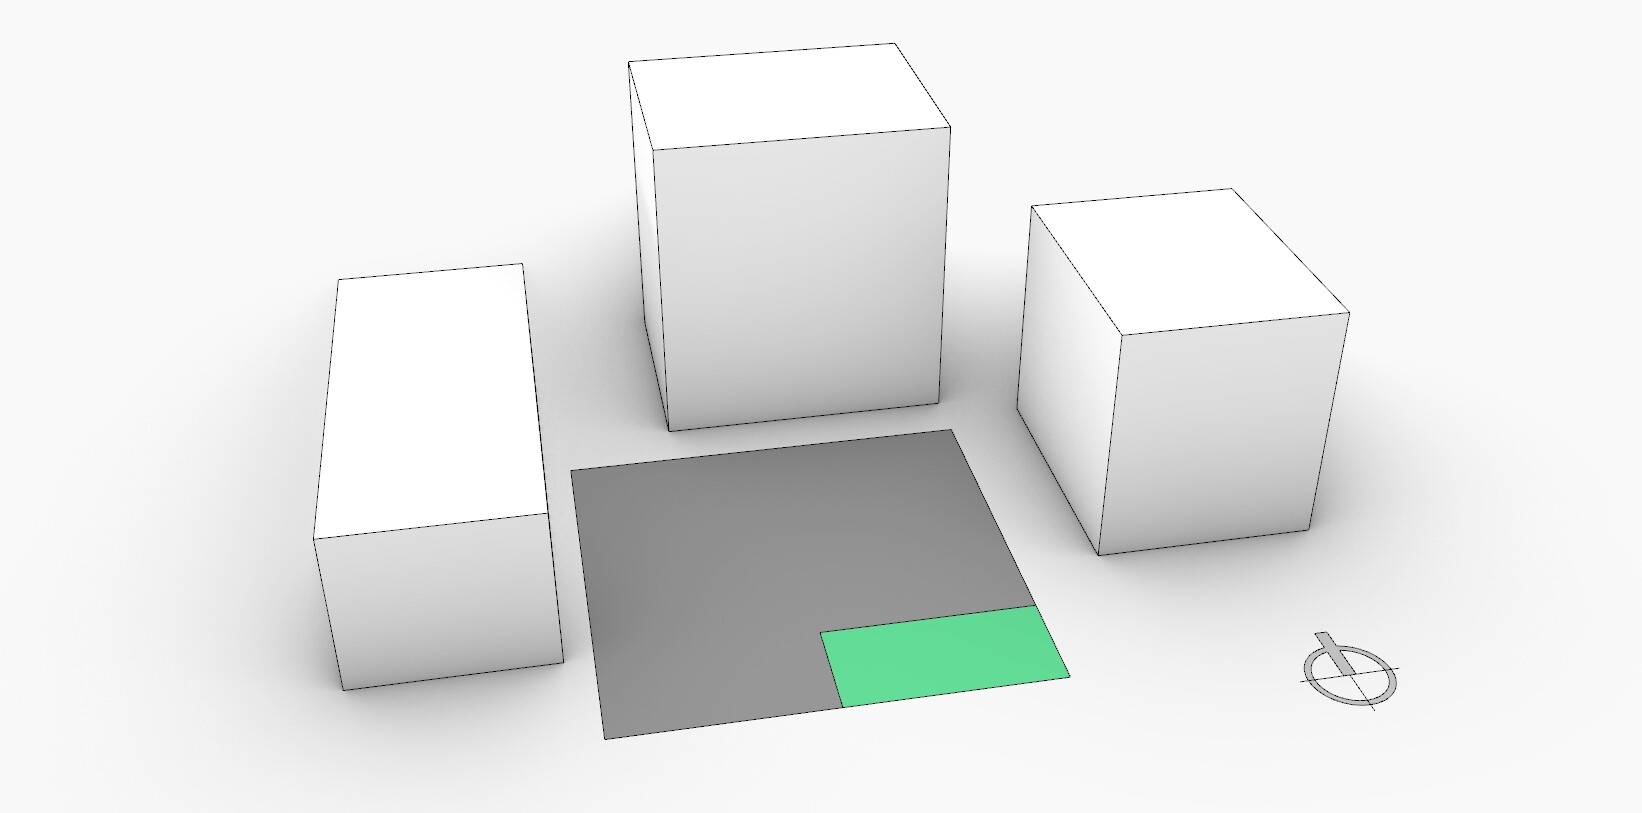
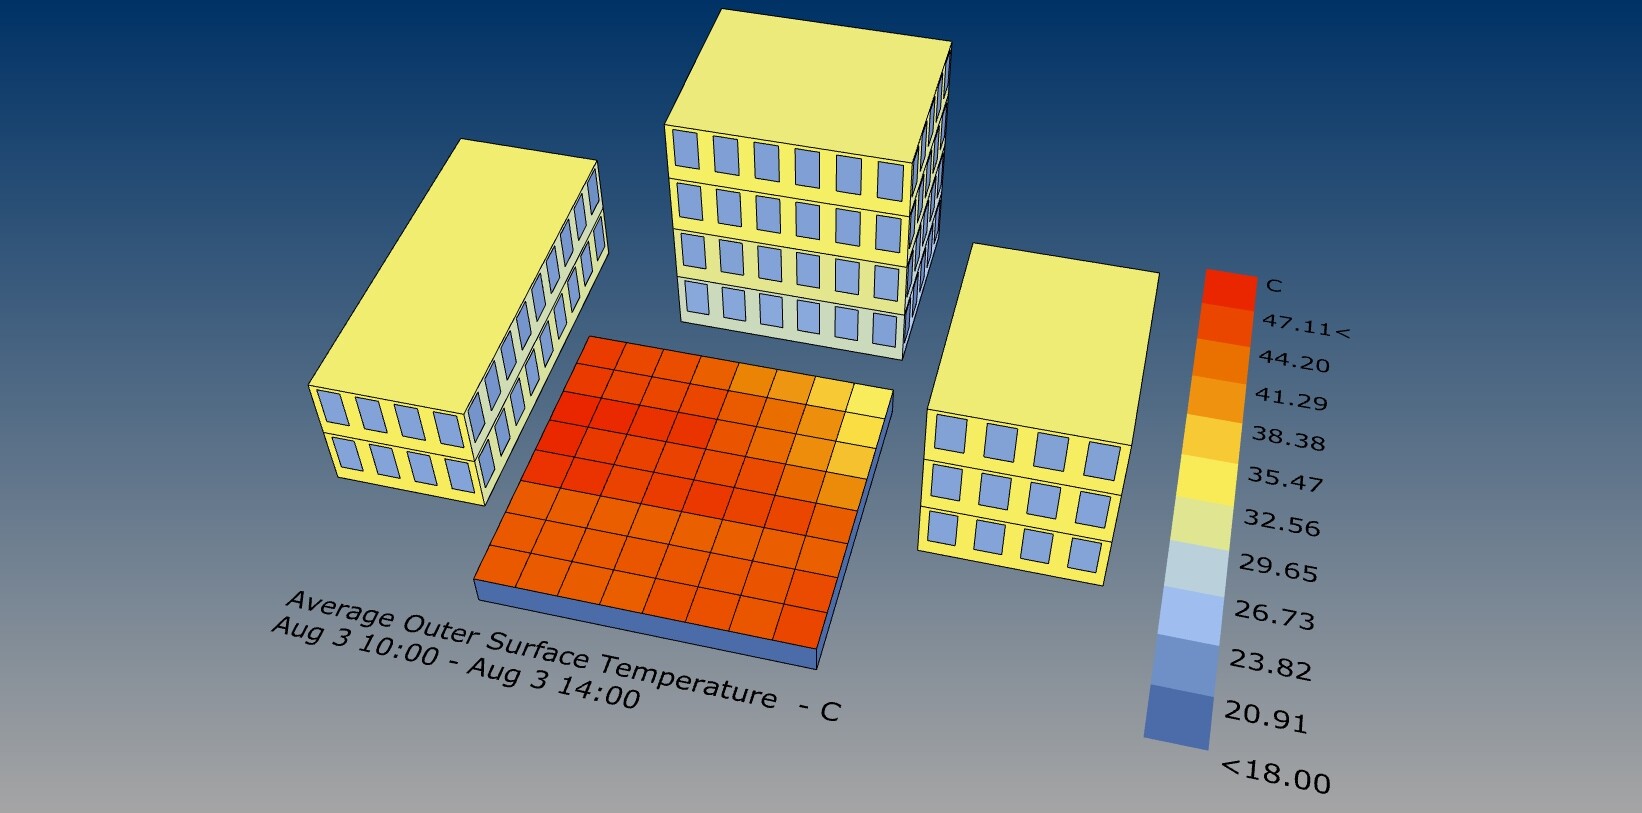
This figure presents the surface temperatures using asphalt for all the square area. (The ground volume is extruded toward negative Z).
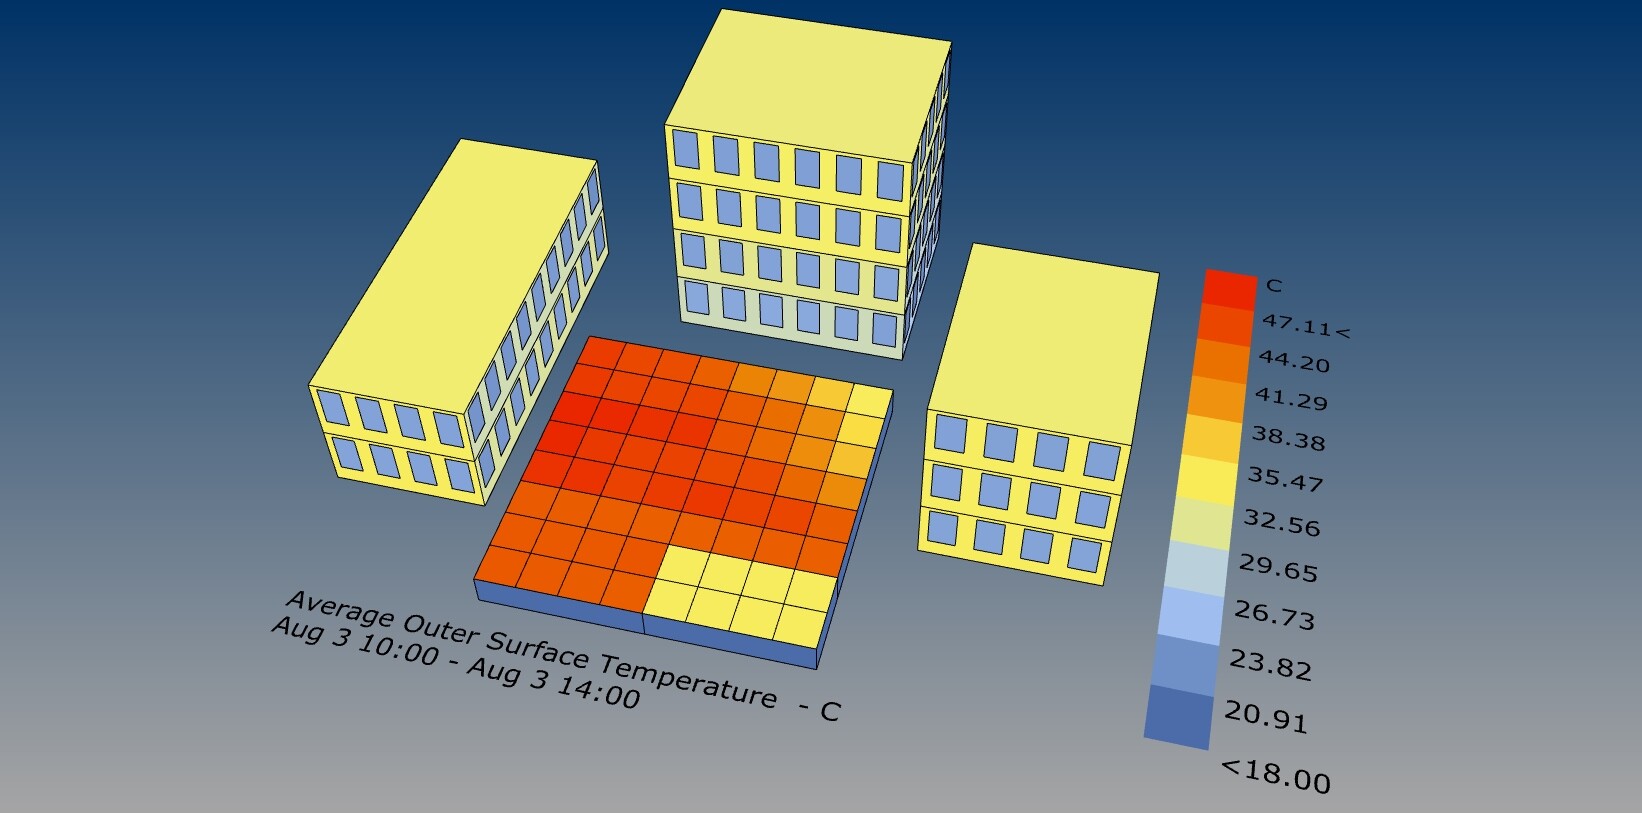
This figure presents the surface temperatures using asphalt for most of the area and grass for the smaller rectangular area shown in the first figure. The surface temperatures of the grass portion are about 12 °C lower than the asphalt.
The following figures shows the UTCI calculation at 1.5 m of height using the Honeybee Legacy workflow. This figure presents the UTCI calculation using asphalt for all the square area.
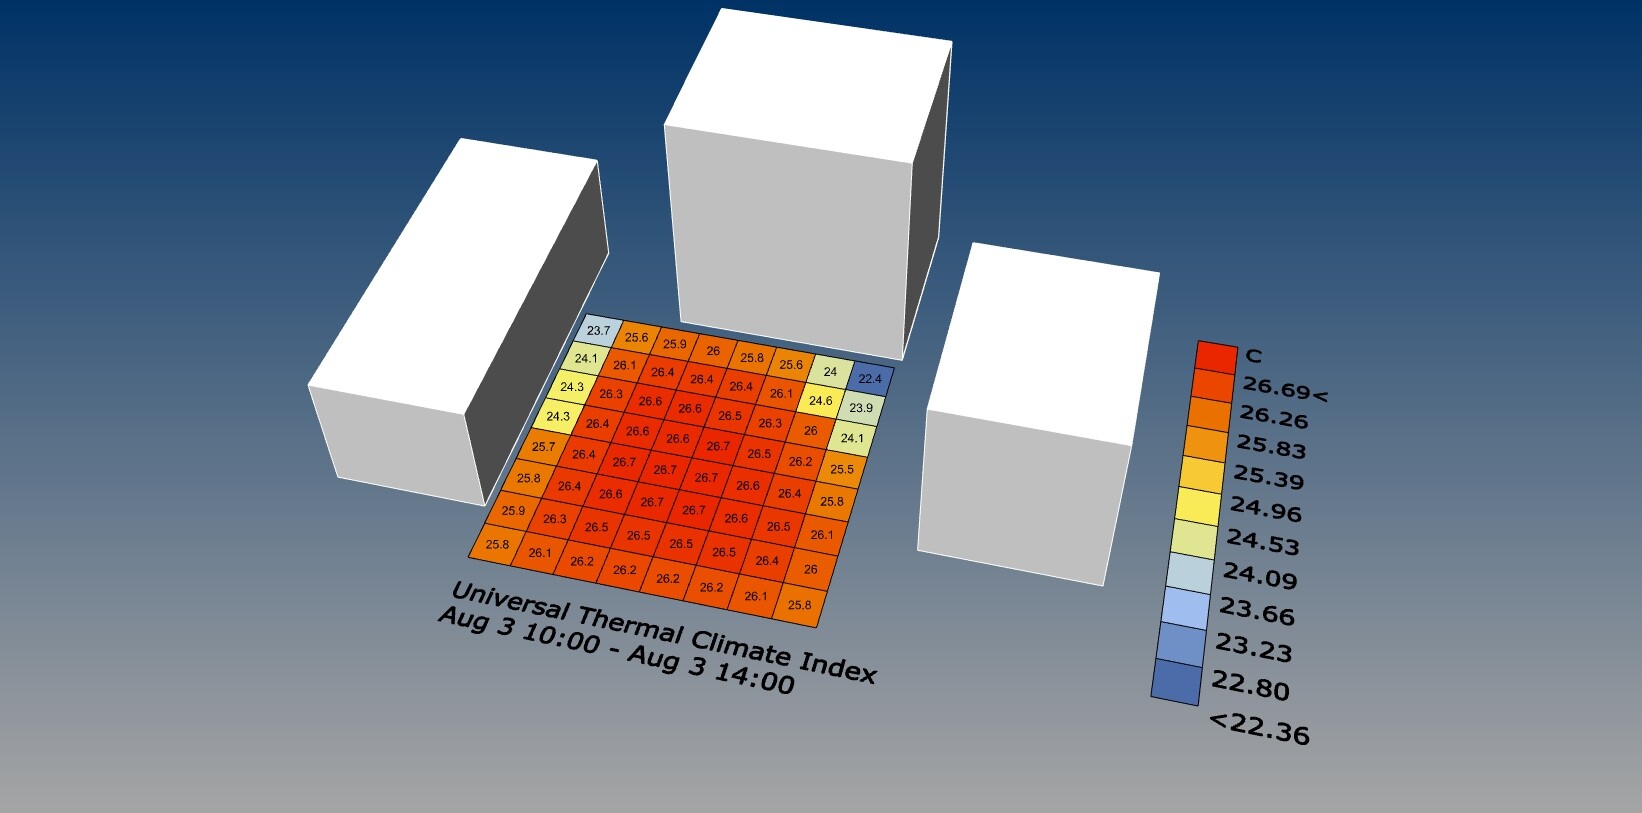
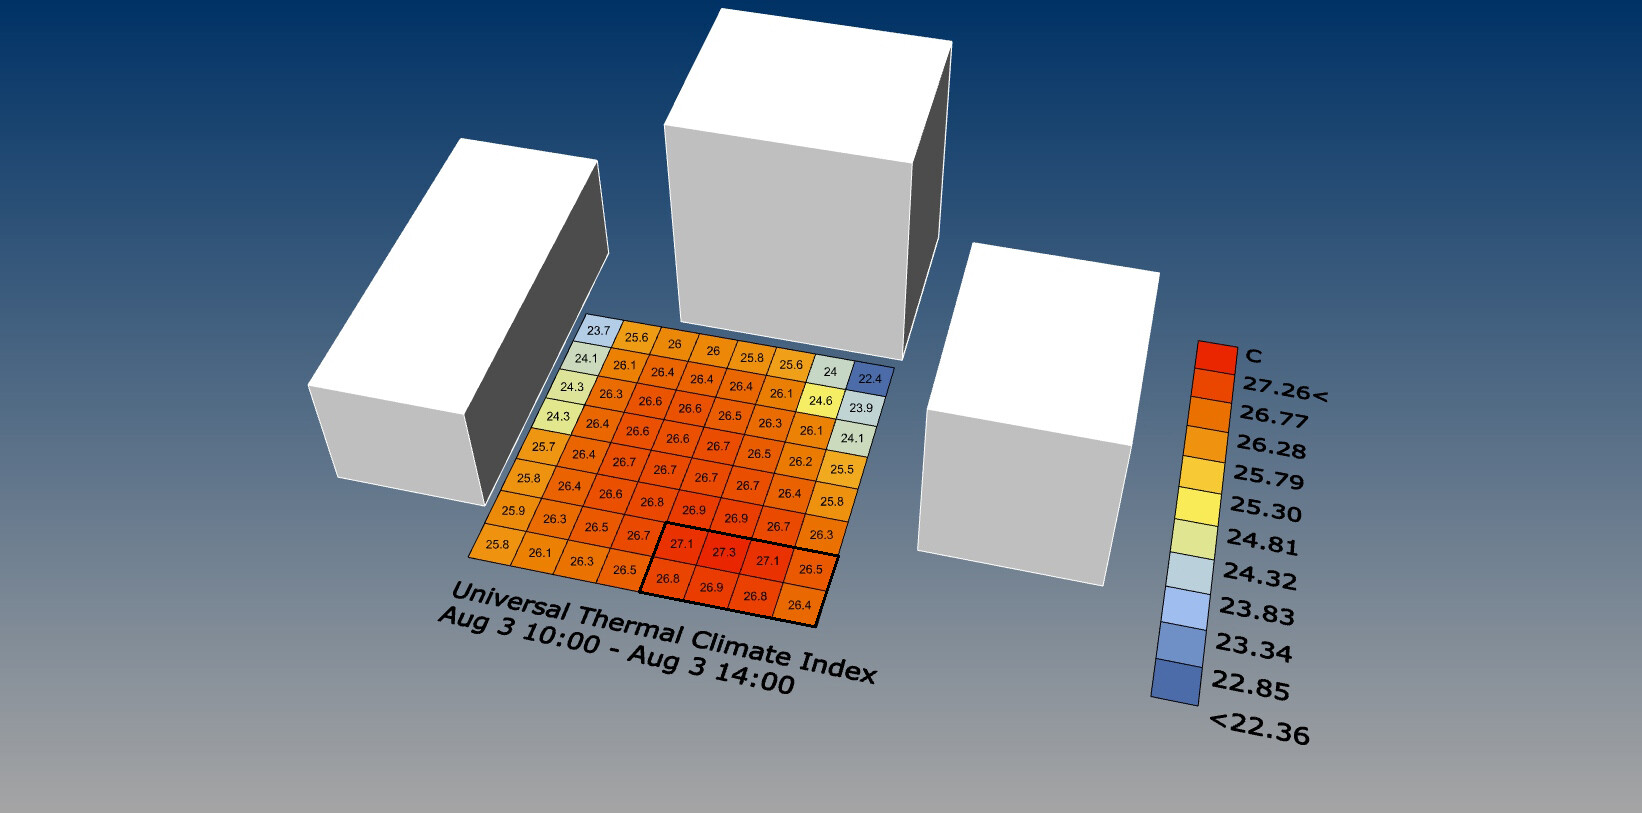
And this figure below presents the UTCI calculation using asphalt for most of the area and grass for the smaller rectangular area shown in the first figure. It is possible to see that the UTCI right above the grass area that yields lower surface temperatures (highlighted rectangle) are slightly higher (up to +0.7 °C) than the UTCI calculated using asphalt also for the pavement of the small rectangular area (that yields higher surface temperatures than grass). Actually above the grass area the UTCI are the highest of the area.
Thank you in advance.
Francesco
UTCI-grass.zip (1007.2 KB)