Outdoor comfort UTCI microclimat map || Vegetation limitations

Hi community,

I recently been trying to get an accurate visualization of the outdoor comfort with Ladybug tools, and especially with UTCI measurement. I followed all hydras possible about that subject and many many posts. As vegetation - trees, green surfaces, and others - play a crucial role in the outdoor comfort, I tried to simulate it aswell.

I’m not satisfy with the results, which didn’t not show the potential and importance of vegetation.

Talking about trees, I obviously used «trees in outdoor thermal comfort» hydra and its a clever way of representing tree foliage. Now comparing a tree with a simple shelter, this is where the results becoming inaccurate. The thermal comfort under a tree, because of evapotraspiration, is supposed to be greater then under a shelter. Results suggest something else as evapotranspiration factor is not taken into account in the equation.


Before tweaking the results, I’m wondering if you have any suggestion ? I could obiously set tree transparency to like 0.9, and all other objects, like buildings and shelter at 0.5 … but I’m not sure… Is it possible to add a «cooler» effect which could simulate evapotraspiration ?

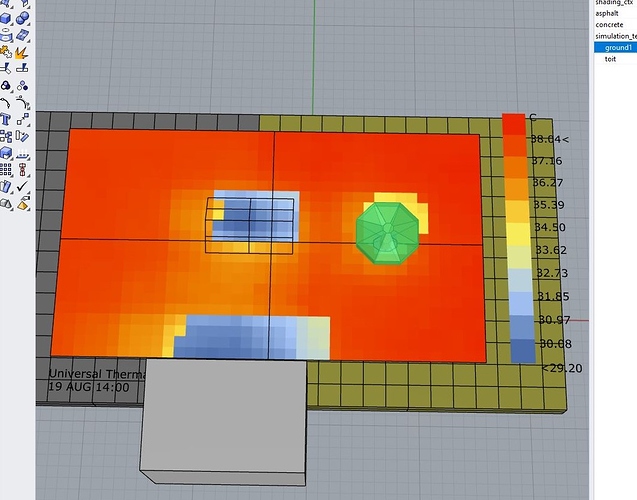
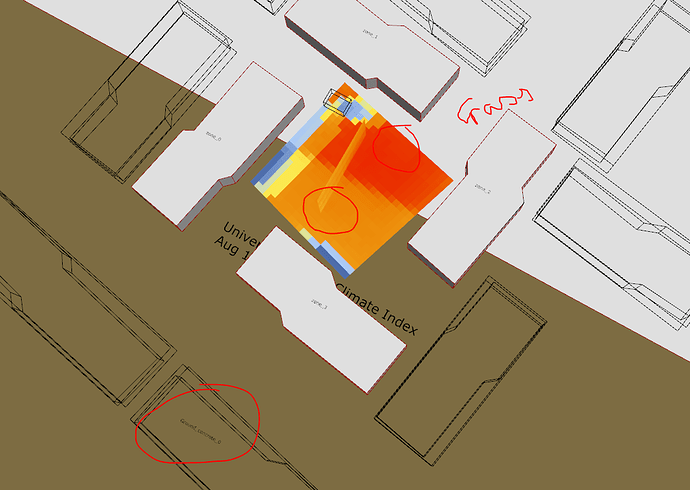
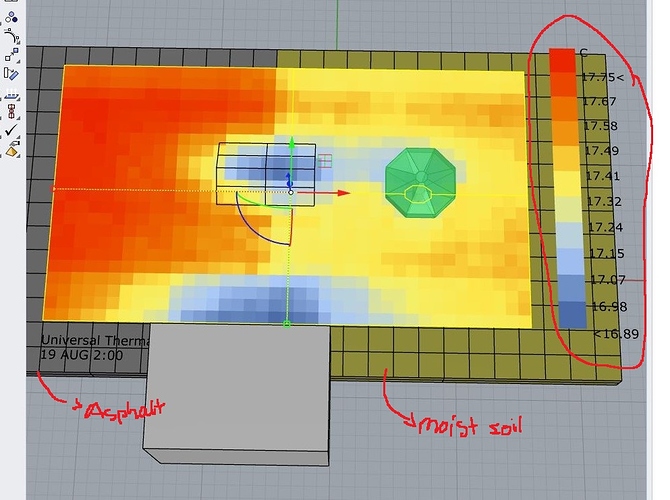
About surfaces temperatures, we have the same issue which is discussed in detail into this post. I’ve simulate it, and end up with the same results. Temperature is way higher above a green surface then an asphalt surface which didn’t make sens (see image above).

First, I tried to tweak the grass material without success. Experimenting around, I assume a decisive factor regarding the surface temperature is the density (kg/m3). It seems like other factor didn’t impact alot.

Secondly I tried to model the terrain with default ground materials (which required brep instead of surface).
During the night at 2 am we can see a difference (but its barely a degree)…

And during the day difference is negligable. I was expecting at least a 3-4 degree difference.

So in conclusion, as I’m trying to be convincing on the postive effect of vegetation on our thermal comfort (and much more), the results didn’t help me much here :confused:

From what I saw, many efforts where already deployed to create this UTCI microclimate map (@chris mackey and all other contributors and testers), Is it something that we can develop one step further instead of directly switching to Envi-met ?

Microclimat_test_V1.gh (3.2 MB)

Best regards,
Charles C.
@CharlesCollin,

  1. Unfirtunately, I had the results similar to you and @mrbro. The green surfaces always appear at least a degree or two hotter than the other surfaces such as concrete. Similar to you, my thought was also to try the Honeybee_Ground zone even though it was a departure from the actual design. Again the results were not as I expected them to be.

  2. As far as evapo-transpiration from trees is concerned, I don’t think that effect is considered either in the definition or the calculation of UTCI.

1 Like

One way to account for effect of these green areas will be the Urban Heat Island simulation with Dragonfly and warping the EPW file. There, evapo-transpiration from grass and tress is considered.

Hi @CharlesCollin

Current methodology does not take into account evapotranspiration from vegetation, the ground or water features. Few methods out there exist for evaluating the effect of evapotranspiration on outdoor comfort. Envi-Met is probably the most established and ready to use solution. Others suggest to tightly integrate it with CFD to get high accuracy: paper
I wrote my master thesis on the subject and tried to integrate the effect of evapotranspiration in a Ladybug Tools work flow. As you are the second one asking about evapotranspiration this week, I probably should take some time and make a tutorial for demonstrating my thesis. I discussed this topic with @devang earlier this week: post

As for your question about the soil types: My guess is when you change soil in EnergyPlus you just change the albedo, heat capacity and heat storage of the material (density is an important component in this). This should lead to an effect similar to the UHI. That the temperature is just a little higher during the day, but the temperature doesn’t decrease as much during the night because of the higher heat capacity/storage.

5 Likes

@ChristianKongsgaard,
Thanks for joining the thread. I would be very interested in a demo. I have downloaded the paper and your thesis you shared in the last post and I am going to read it soon. This is something that a lot of people will be interested in.

I just wanted to add a note about the Dragonfly suggestion that @devang brought up. At the moment, the Urban Weather Generator (UWG) does account for vegetation evapotranspiration but it is an extremely simple model that is in need of more development. Specifically, the UWG just models vegetation evapotranspiration as the absence of sensible heat (expressed by a latentFraction) and it does not do a full moisture balance of the urban area to figure out the impact of vegetation evapotranspiration on relative humidity or check the relative humidity to see if we are getting above the saturation point. So, while using the UWG is model better than nothing, take the specific results with a grain of salt.

@ChristianKongsgaard 's evapotranspiration work seems a lot more robust than anything currently in the UWG so I would recommend using his scripts if you are after a more detailed representation of evapotransipiration. Speaking of this, @ChristianKongsgaard , given that your scripts are in Python, it seems worthwhile to see if we can integrate them into the UWG. I posted some questions on the UWG github here if you wouldn’t mind answering them when you get the chance :

From what I can tell, the EnergyPlus vegetation material is actually doing a moisture balance calculation and you should read the documentation of it to make sure that you are using it correctly. As @ChristianKongsgaard says, make sure you are checking all of the properties of the vegetation to avoid a “garbage in, garbage out” scenario.

3 Likes

Indeed. Work of @ChristianKongsgaard definitely seems to address evapotranspitation more comprehensively. However, as @chris said, it is good to use UWG workflow rather than completely not accounting for it.

It is also to be noted that out of all the parameters that go into UWG, the parameters that the UWG is most sensitive to are; Site coverage ratio, facade-to-site ratio, and the vegetation. - Nakano A., Bueno B., Norford L., Reinhart C. (IBPSA 2015). Urban Weather Generator - A Novel Workflow for integrating urban heat island effect withing urban design process.

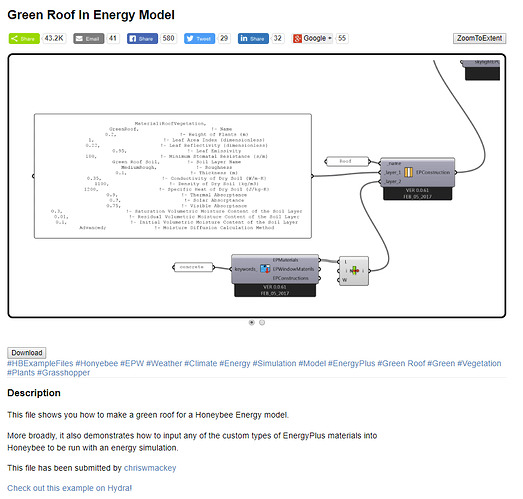
I modelled a vegetation roof for sport building with honeybee. For the outer layer of the vegetation roof construction I used the following material definition:

Material:RoofVegetation,
GreenRoof, !- Name
0.2, !- Height of Plants {m}
2, !- Leaf Area Index {dimensionless}
0.27, !- Leaf Reflectivity {dimensionless}
0.95, !- Leaf Emissivity
180, !- Minimum Stomatal Resistance {s/m}
Green Roof Soil, !- Soil Layer Name
MediumRough, !- Roughness
0.1, !- Thickness {m}
0.35, !- Conductivity of Dry Soil {W/m-K}
1100, !- Density of Dry Soil {kg/m3}
1200, !- Specific Heat of Dry Soil {J/kg-K}
0.6, !- Thermal Absorptance
0.6, !- Solar Absorptance
0.6, !- Visible Absorptance
0.6, !- Saturation Volumetric Moisture Content of the Soil Layer
0.01, !- Residual Volumetric Moisture Content of the Soil Layer
0.45, !- Initial Volumetric Moisture Content of the Soil Layer
Advanced; !- Moisture Diffusion Calculation Method

This material resulted in a 20 degrees lower surface temperature compared to a normal roof construction.

4 Likes

@Erikbeeren,

this is great, I’m curious about the definition. Do you mind sharing it ?! And any screenshots ?

Regards,
-CC

@CharlesCollin

If you wanted the RoofVegetation example, you can refer to this case created by @chris .
http://hydrashare.github.io/hydra/viewer?owner=chriswmackey&fork=hydra_2&id=Green_Roof_In_Energy_Model&slide=0&scale=1&offset=0,0

1 Like

Hi @CharlesColin,

I used the example of @chris which @minggangyin referred to.
I only changed some of the default settings to custom settings.

@CharlesCollin, @minggangyin

For getting good results, both the height of the HB “ground” zone as the thickness off the soil layer have a big effect on the results.
The height of the HB “ground” zone has to be 0.5 [m] or more.
For the thickness of the soil layer I used 0.2 [m]
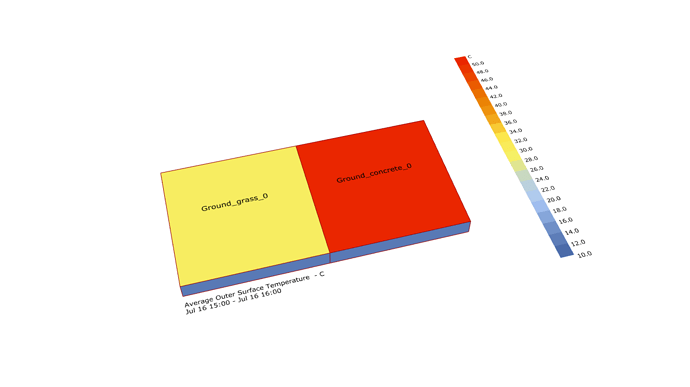
I used the HBGrndZones component and modified the roof construction for both the grass surface as the concrete surface.

1 Like

Hi,@Erikbeeren Thanks for your detailed example and good visulization. Could you share this grasshooper file?

OutdoorComfort_HB.gh (609.5 KB)

And the EPW file I used from 2018 Deelen (Netherlands) which was an extreme sunny and dry summer in the Netherlands and Europe.

2752018.zip (167.0 KB)

1 Like

Thanks for the example @Erikbeeren, opening your example is correct, but when I apply this material and batteries, the thermal properties results are reverted, I mean, the grass Is hotter than concrete, I would like to attach the model, but it says I am a new user.

Hi @gonchotorena,

I checked the model again. When i run the simulation I get the same results as in the animation.
What could be the issue is that the order off the zones created is different when you open the file.
The tags which I put above the zones in that case do not correspond with the zones. In the attached file I changed this and used the honeybee label zones component.

OutdoorComfort_HB.gh (613.8 KB)

Thanks for your answer @Erikbeeren . My fault, I wanted to say that the problem happens when I apply your grasshoper model to my own project. Finally I can attach the model.

I attach now the model
Example.zip (985.2 KB)

New upgrade: Last night I was checking again. One problem was the epw file, I was using in your example a epw different from energyplus webside and it was the error. But if I copy your batteries of grasshopper in my model (The example attached) I still getting the error, including using the correct epw file.

Thanks for helping.

Hi @gonchotorena,
I attached your weather file to my model and and had the same results as you had. The grass surface heated up more then concrete surface. In reality this can’t be the case. If you walk bare-foot outside on a hot sunny summer-day, you will burn your feet on concrete pavement but will still be able to walk on the grass. So your case shows more study is needed. In my case I wanted some realistic looking results to use for comfort mapping. I studied two parameters: The thickness of the ground zone and the thickness of the soil layer with the help off Colibri https://www.food4rhino.com/app/tt-toolbox. The best thing you can do is to use the small model I sent earlier for testing and change the settings in order to get more realistic looking results. For more detailed information about how the calculation on the green-roof is done you can have a look here: https://bigladdersoftware.com/epx/docs/8-0/engineering-reference/page-029.html.
Besides that, I looked at the results using your EPW file in my model and was surprised by the temperatures of the concrete surface. They seemed much to low. I think also that part needs some extra study and testing.

Thanks for the information and the references. Im gonna check the problems, but its probably I will use the official epw files.

I´m new with ladybug, when you say tickness of the ground zone you refer the distance of the extrusión of the geometry, isnt i? As well the thick of the soil is the material, in your example 1m. Is it correct?

Thank you for you help, and Im go on investigating.

Yes, but you can try also the other parameters. For instance the “leaf reflectivity” has also a huge impact on the results. In the input/output reference of energyplus on page 214 you can find more information about the different settings.

1 Like