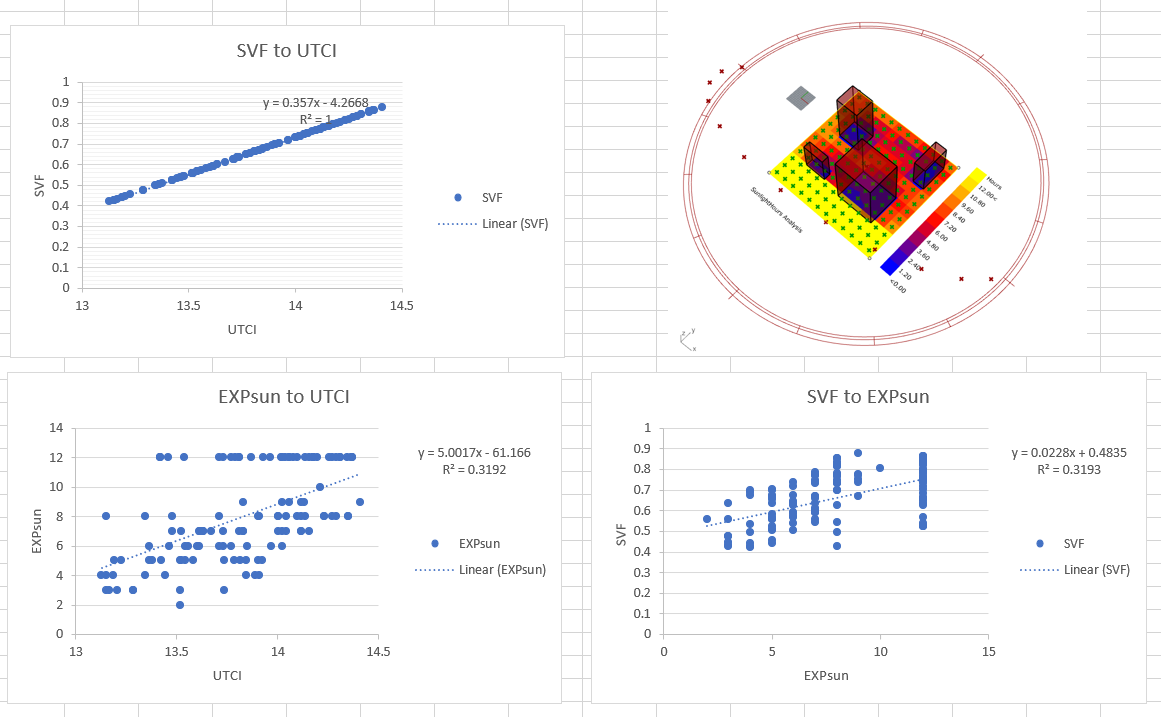
I just want to share an interesting correlation result between the sky view factors (SVF), daily averaged (UTCI) and daily sunlight exposure (EXPsun). All 144 sample points are considered in the correlation, from 12-hour simulation on spring equinox day.
I don’t know how you obtained your values, but I’m guessing only your MRT value changes with regard to its position, while your drybulb, RH, and wind speed parameters are represented solely as values that change in time (i.e taken directly from the EPW file rather than simulated with regards to local microclimate). Since you are taking the average of the temporal values, this means all your temporal values have the same value for each location.
The result is that your UTCI only has a variance associated with its MRT axis, (which in turn is a function of the SVF), and has zero variance associated with the other inputs. The SVF thus explains all of the variance in your dataset (R^2=1).
Correlation_UTCI_SVF_EXPsun.gh (139.8 KB)
Thanks Saeran for you reply! Your assumption is correct. See attached the gh file. The only variable for MRT is SVF, so for UTCI.
So, it is meaningful to correlate sunlight hours with SVF/MRT/UTCI, rather the correlation between the latter three per se.
However, I am wondering if it makes sense to correlate the SVF/MRT/UTCI result from ENVI-met, as the values are simulated by CFD-based algorithms.
@Kai_zp, yes any method that modifies your input values to reflect their spatial impact will correct your correlation.
You may already know this, but be careful using correlation as a metric to determine dependence between your variables. Correlation is a measure of linear dependence while the UTCI regression is polynomial[1] (and thus a nonlinear transformation). Correlation could still be useful even for nonlinear cases (for example I use correlation to confirm my covariates are not linearly dependent) but just keep in mind that your variables can still be non-linearly dependent.
[1] Although it’s possible to linearize any polynomial by pre-exponentiating inputs, but that would be very complicated to attempt with the UTCI.
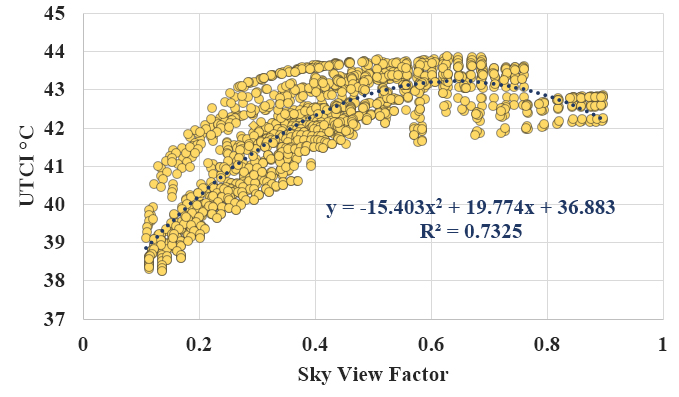
@Kai_zp This is what I’ve got when I made a regression of 1716 cases using:
MRT changing based on the geometry
Air temp and rel humidity slightly changing, calculated using Dragonfly
Wind speed not changing, retrieved from the weather file.
I reckon, even if Ta, V and RH aren’t changing, and your UTCI is solely dependent on MRT, it’s very less likely to obtain such a unity correlation. @SaeranVasanthakumar Would you please recommend some of the literature behind the UTCI regression? I’ve used here 2nd order polynomial trendline, but I need some rationale for choosing this trendline specifically.
Many Thanks!
(1) I wonder - What 1716 cases means - 1716 grids of a single outdoor space or the sum of these grids from several different cases? Are these cases from one simulation (a specific time of a day) or the aggregation of several simulations(at different times in a day)?
(2) How do you obtain Ta and Rh in dragonfly? Are you using the ENVI-met?
To reply to your question on my strange unity correlation:
(1) I used the daily averaged values to calculate the UTCI and MRT. All 144 samples are grid-based, so the numbers of the UTCI and MRT outcome are 144 too, not hour by hour. Perhaps I will try to overlay the UTCI and MRT from 12 hours of daytime on the scatterplot in the next step (I still doubt if that would change anything because SVF doesn’t change with time)
(2) The only spatial variable for the MRT and UTCI component is SVF. All other inputs are just single values from the EPW file from the airport.
@Kai_zp The 1716 cases are for different geometries of an urban canyon, changing street width, building height and orientation, so the SVF is changing accordingly. My results are pretty much presented as yours; the average of all grid points (the number of which also depends on the canyon geometry), the average of the simulation period (15 hours of daytime). In total I had 1716 cases with 1716 SVF and UTCI average values. In my first comment I was trying to say I almost had the same situation like yours but ended up with a different correlation.
By Dragonfly, I mean Urban Weather Generator, which takes a rural weather file and, based on some properties (surface roughness, materials thermal properties, avg buildings heights, glazing ratio, etc) generates a weather file that represents the thermal conditions of an urban area. Intrinsically, it only morphes two variables in the weather file, which are the air temperature (Ta) and relative humidity (RH), so nothing with ENVI-met.
Best,
@YASSER_IBRAHIM I see your point. An extra question - how do you set the inputs for MRT and UTCI?
For calculating MRT - is the surface temperature from the air temperature in EPW data? how about the direct/diffused and horizontal infrared radiation, also from the EPW data? In my simulation, all of them are from the EPW, following a tutorial on YouTube.
For calculating UTCI - are the Ta, Rh values from the EPW data?
@Kai_zp I’m using the legacy version of LB-HB, see this post. Surface temperatures are calculated by EnergyPlus, which indirectly uses air temperature (from EPW) for convection heat transfer. Direct/diff and Horizontal IR are all from EPW. for UTCI, Ta and RH are from the morphed EPW by UWG (in my previous comment), rather than the original EPW.
Best,
@YASSER_IBRAHIM Thanks for sharing the link. I am wondering at what level this MRT is being calculated? If using the ground surface temperature, does that output the ground-level MRT, rather than the MRT at 1.5M (human height)? Though there is no component for simulating air temperature for each grid in LB. Secondly, can I use LB radiation analysis output for the Horizontal IR?
Best
Kai
Yes, Yasser brings up a good point. If the relationship between the SVF and UTCI isn’t linear, then the RSS won’t be zero, and thus your R2 won’t equal one. In either case, the contribution of non-SVF variables to the regression should still be zero (i.e their coefficients should be zero), assuming you guys are both taking the average of the raw UWG/EPW values.
I don’t really have enough knowledge about the UTCI to understand why the relationship between the UTCI and SVF is linear in your model, and not in Yasser’s. But one thing that I noticed is that you guys have quite different UTCI ranges. It could be that the UTCI/SVF relationship is linear with colder temperatures and nonlinear with hotter temperatures (maybe diminishing returns from outdoor solar comfort with hotter temps?).
@YASSER_IBRAHIM I haven’t really done much reading on the UTCI, unfortunately.
@Kai_zp, I’ve checked your gh file and found out that you’re calculating MRT and UTCI without the effect of the geometry, which means that your results were recorded for a naked ground surface. Also, you’ve used air temperatures from EPW for MRT calculation rather than surface temperatures which should be calculated by EnergyPlus. I guess this is why you’re having misleading correlations. If you’re looking to simulate the effect of your geometry on the outdoor MRT and UTCI, then you have to use the Legacy versions of LB v.0.0.69 and HB v.0.0.66, as the outdoor microclimate map hasn’t been added in the newest LB v.1.1.0 yet.
The detailed procedure for calculating MRT and UTCI (or PMV etc.) is described in these papers.
http://www.ibpsa.org/proceedings/BS2019/BS2019_210301.pdf
You can find the corresponding LB-HB workflow in this link along with the simplified workflow (which is I’m using) in this link. You can choose the height above ground to calculate the MRT. The workflow can be coupled with OpenFOAM via Butterfly to simulate the wind speed at each grid point; however without taking into account the turbulent heat transfer, which I believe is a WIP project for Mackey and Roudsari. Finally, Horizontal IR values come directly from the “Import_EPW” component and have nothing to do with the radiation analysis. I hope that would help. @SaeranVasanthakumar no problem! always pleasure having such discussions.
Best,