Sorry for reply lately. Thanks a lot
Hi @Erikbeeren,
Coming to this conversation a little late, but I’m having a similar issue with trying to add grass to a surface and comparing it to concrete. If I use your file directly, then I get the following result
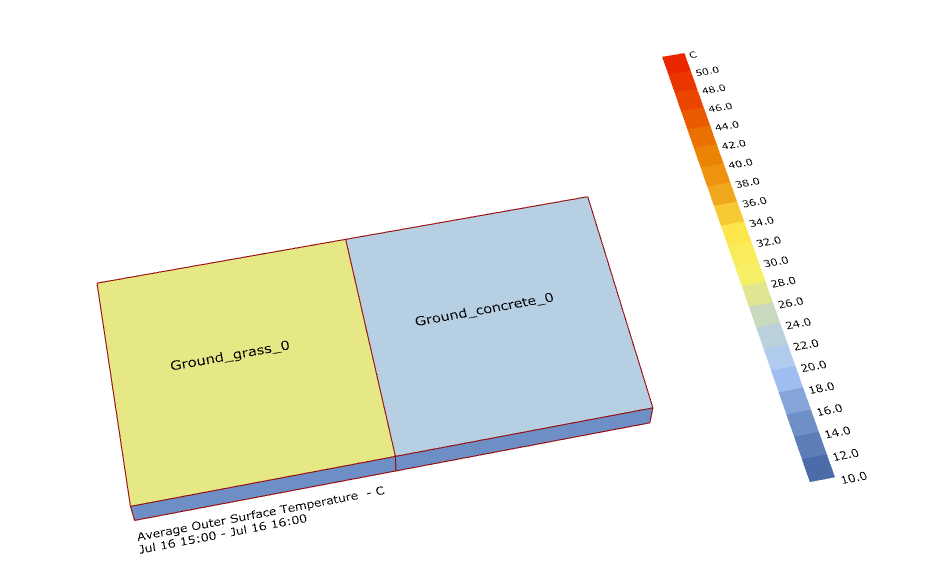
The grass in all cases performs worse than concrete… In applying the same method to a larger model, its doing the same.
Attached is my version of your file with the epw file I’m using direct from E+ database.OutdoorComfort_HB_melbourne.gh (625.1 KB)
Hi @ElzineBraasch,
I think you have to dive deep in to the energyplus calculations to really understand what is happening. Wich factors are taken into account and wich are not and how this relates to the physical process described in different literature. I did not have time yet for doing this.
As @Erikbeeren suggests, there are a whole host of reasons why concrete would be cooler than grass, especially when the surfaces are relatively cool like in your screenshot. Usually, concrete has a higher albedo than grass so it absorbs less energy to begin with. If the climate is humid (like Melbourne), then the evapotranspiration of the grass isn’t going to have a significant cooling effect. In fact, water has 4 times the heat capacity per gram as concrete so all of that un-evaporated moisture is going to hold onto heat more than the concrete does.
The place where vegetation really helps to cool things is in dry climates where water evaporates easily. I’m sure if you tried out this simulation in the center of the Australian continent, you’d find some different results.
Hi Chris and Erik,
Thanks for the quick responses! I must admit, I’d be curious to know in which instances grass would be better in melbourne’s climate or if the only solution for master planning is more limited to other options like deciduous trees, etc.
Thanks,
Hello
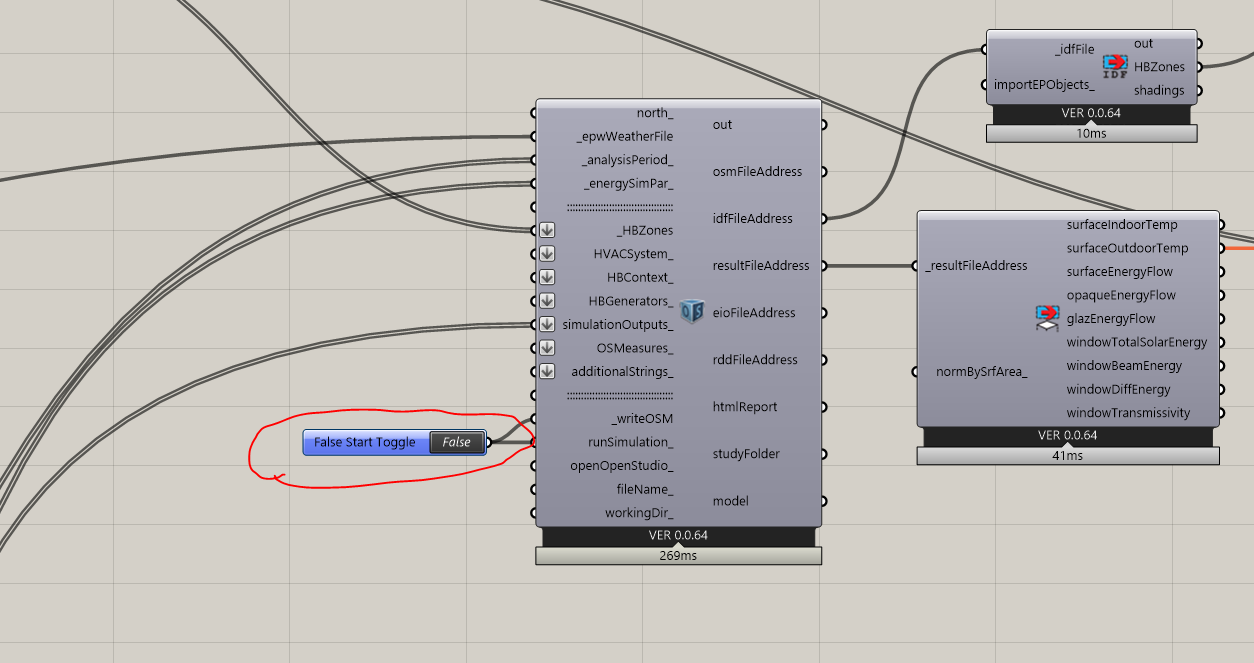
False Start Toggle is missing, where you used it in the definition?
I have been reading the LB forums regarding importing Vegetation units like the tree in Charles’ example and i’m interested to know how one could integrate Vegetation units with the newest version of LBT.
After taking a look at scripts with older versions of LB, I’m wondering what would be the current equivalent component of HB EP Context Surfaces & HB Indoor View Factor Calculator where trees were being added as additional shading (+ transmissivity).
My current goal is to retrieve a UTCI Comfort map of a small district and my workaround with the trees is adding them as HB Shade (with manually determined reflectance values) as parts of a HB Model. Is there another (and more accurate) way?
I am having a similar question with the building facade materials and how I can determine accurate Shade Construction values (since I couldn’t find any defaults).
Thank you!
All of this now happens in the HB UTCI Comfort Map.
This example file here shows you how you can model the effect of trees on outdoor thermal comfort.
Thank you for the quick response!
Lastly, are there any guidelines how I could create a HB Fixed Internal Schedule for the Transmittance of the tree geometries for a specific time period? And should it match with the run period of the simulation, if it’s not annual?
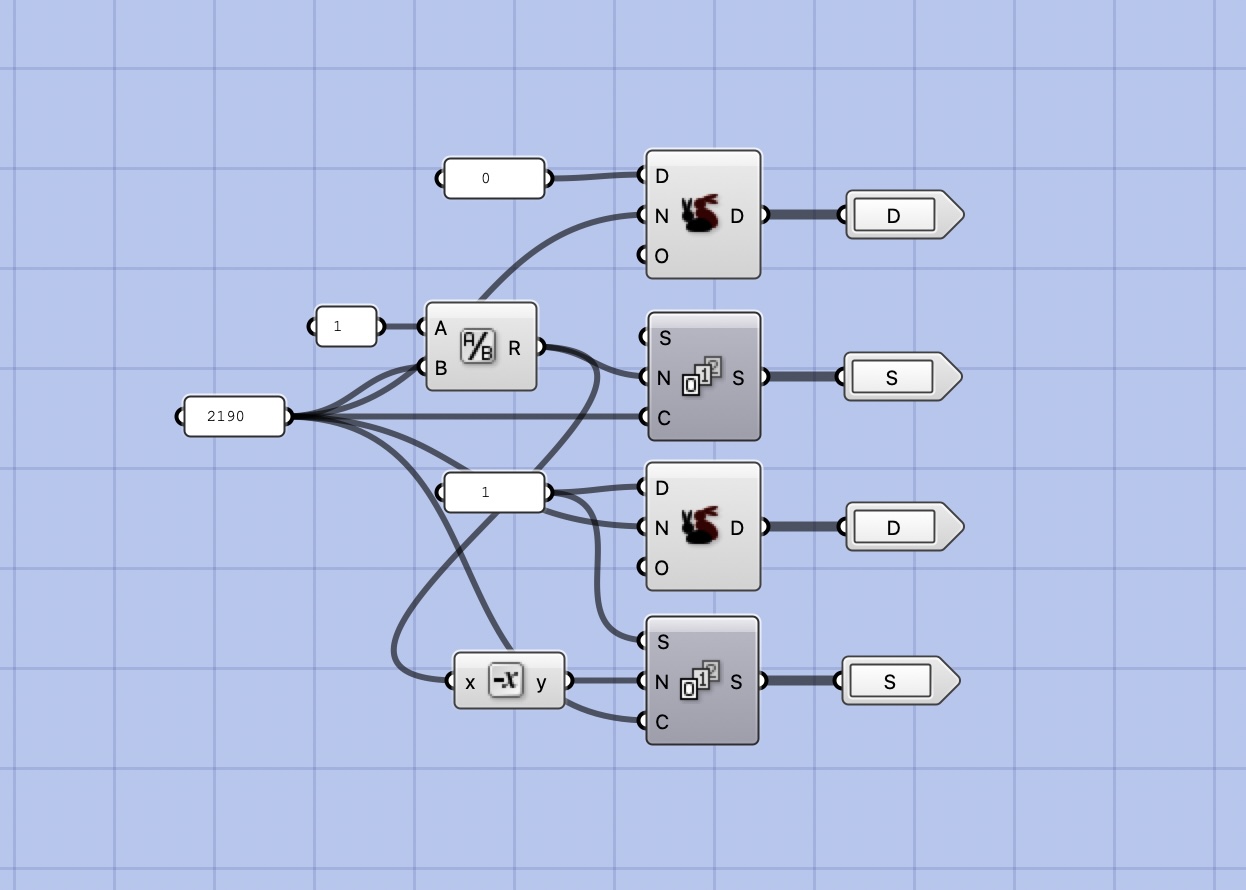
I tested it with the following values:
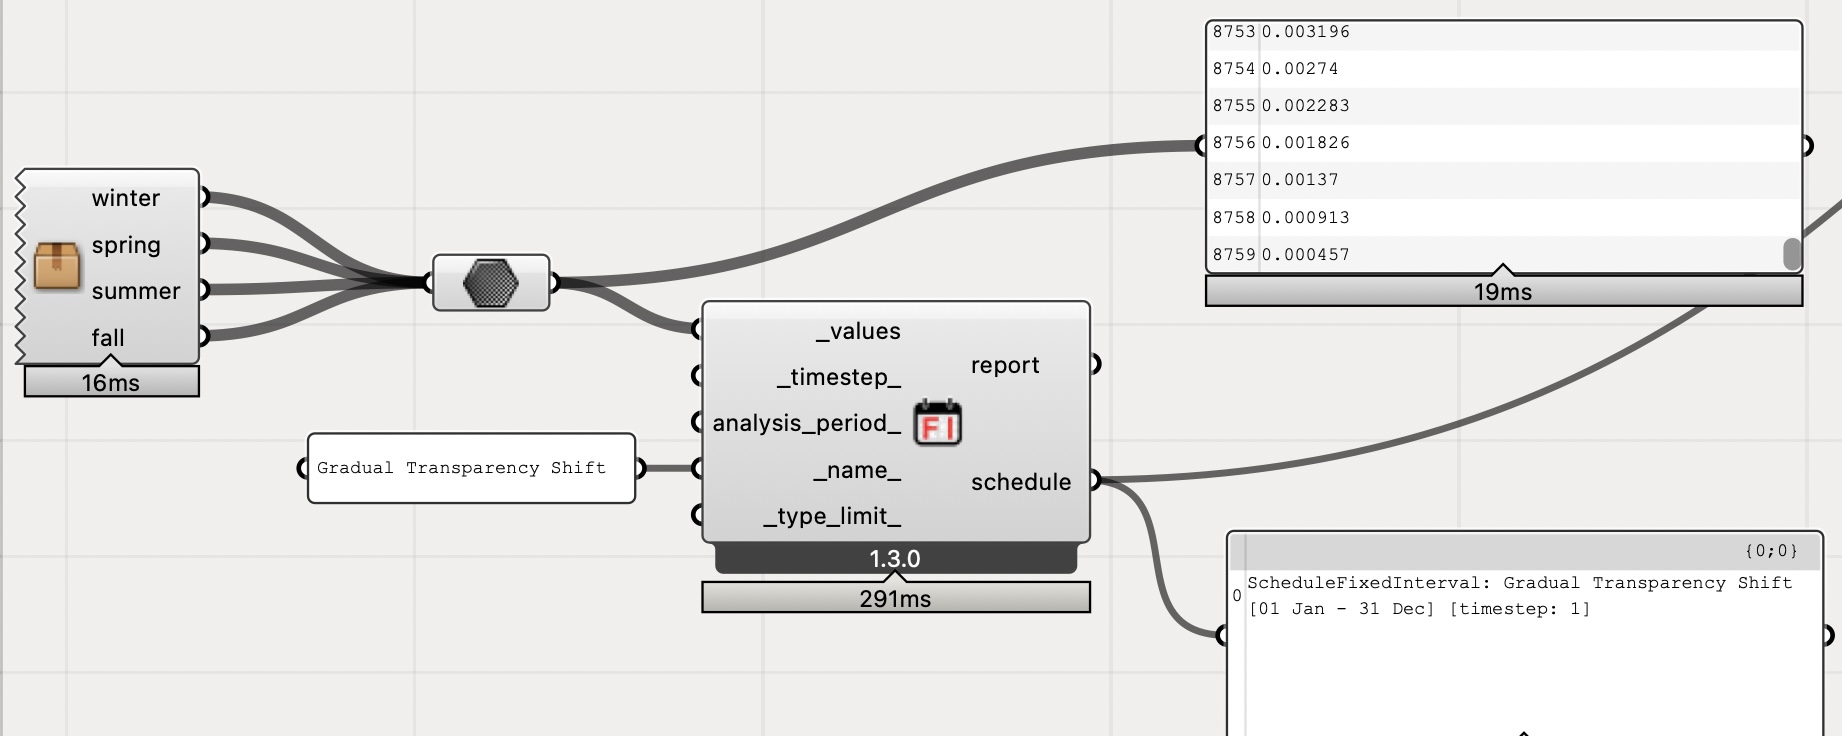
but each time I run the simulation for a specific period (ex. 1 May - 30 August), also an annual one, I get the following error:
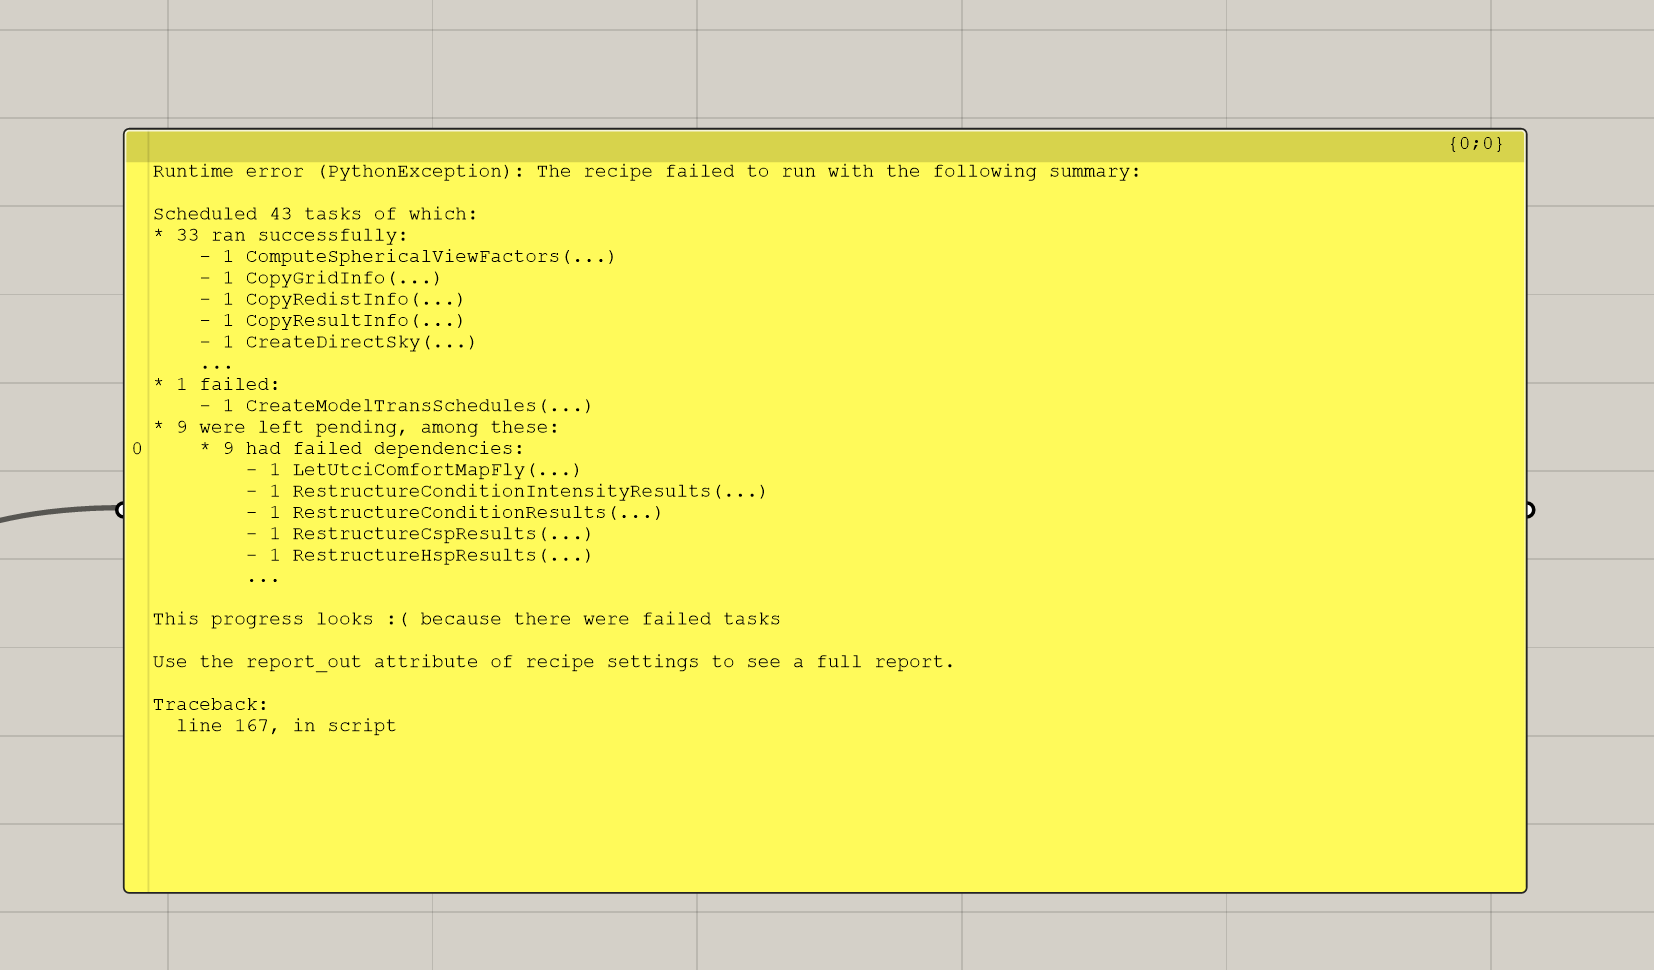
Hey @lorabo ,
Your component and installation versions are pretty clearly mis-matched. You’re using a component from LBT 1.3 for the fixed interval schedule but your core libraries must be newer in order to get that error.
Given how new the dynamic transmittance schedules are in the comfort mapping workflows, I recommend updating to the latest development version of the LBT plugin using the LB Versioner. Then, you can use the LB Sync Grasshopper File component to make sure the components on your canvas are aligned with your installed LBT version.
FYI, this latest version of that sample .gh file has a dynamic tree transmittance schedule so that you can understand the workflow.
Hi @chris,
Thank you for your explanation on the behavior of grass and concrete.
I tried to understand it better using this sample provided in the LBT1.5.0 sample files.
I tried 3 versions.
- with no shade at all
- with tree as just a shade
- with tree as grass material ( by converting the tree to a room and assigning it grassy lawn construction
I ran all the 3 variations on both NY and Riyadh ( Desert Climate )
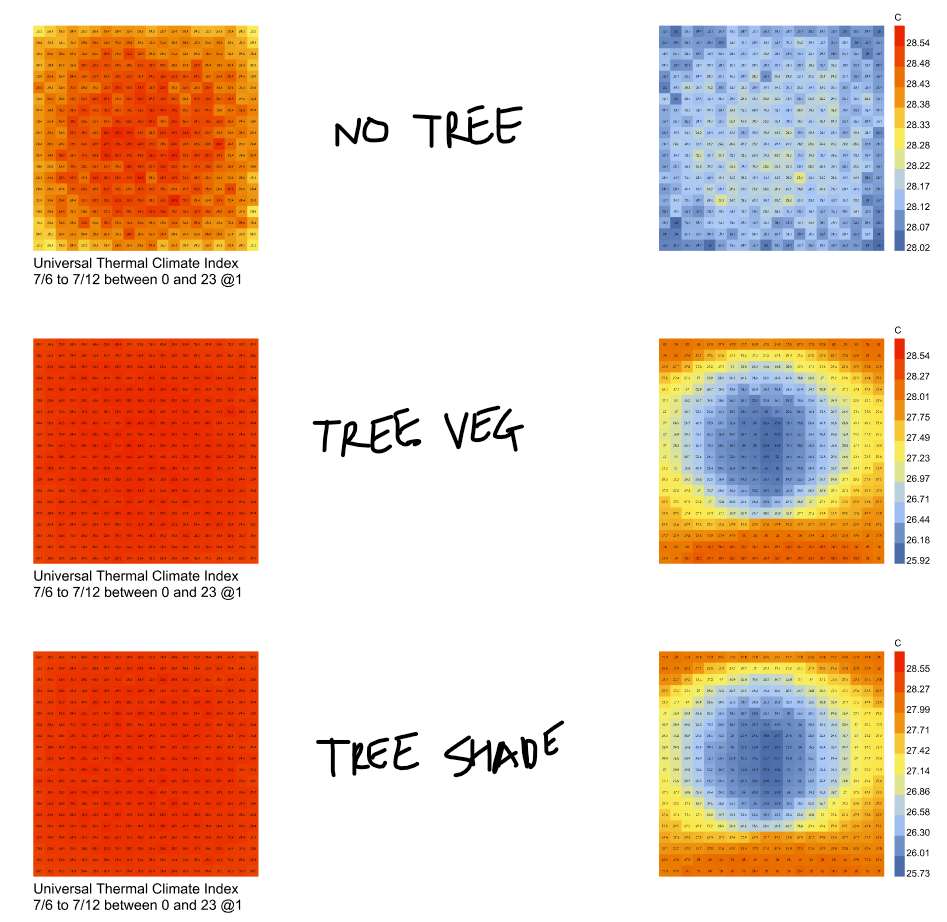
When i run with no shade at all, the difference in the UTCI (on the hottest week) between asphalt and and grassy lawn is around 0.2 °C
The image below is for Riyadh
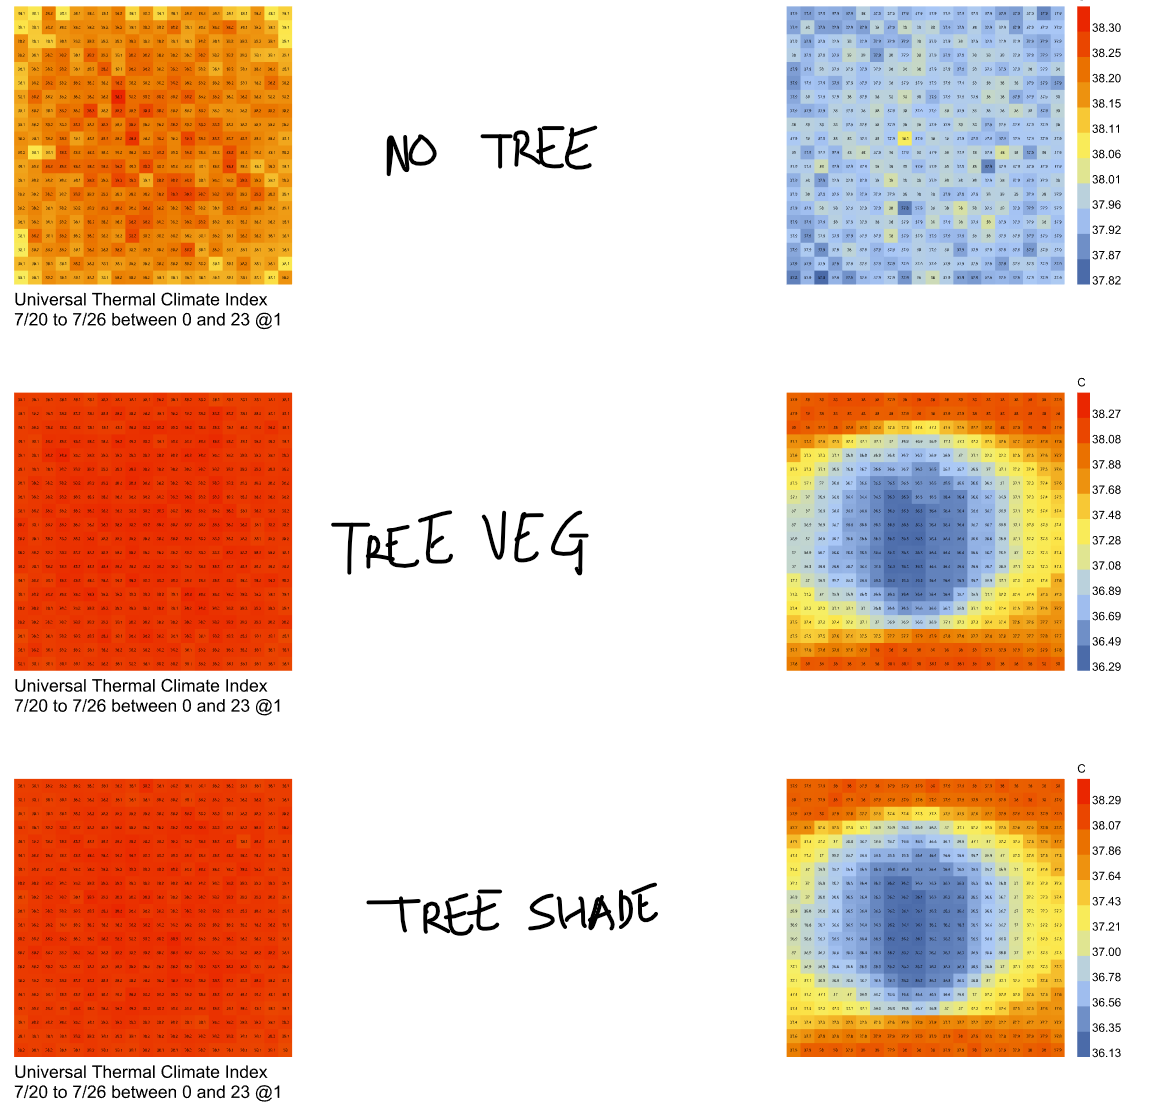
The image below is for NY
I am not sure if my assumptions are right. From what I understood in your explanation, in the dry weather such as Riyadh, the temperature difference should have been slightly higher.
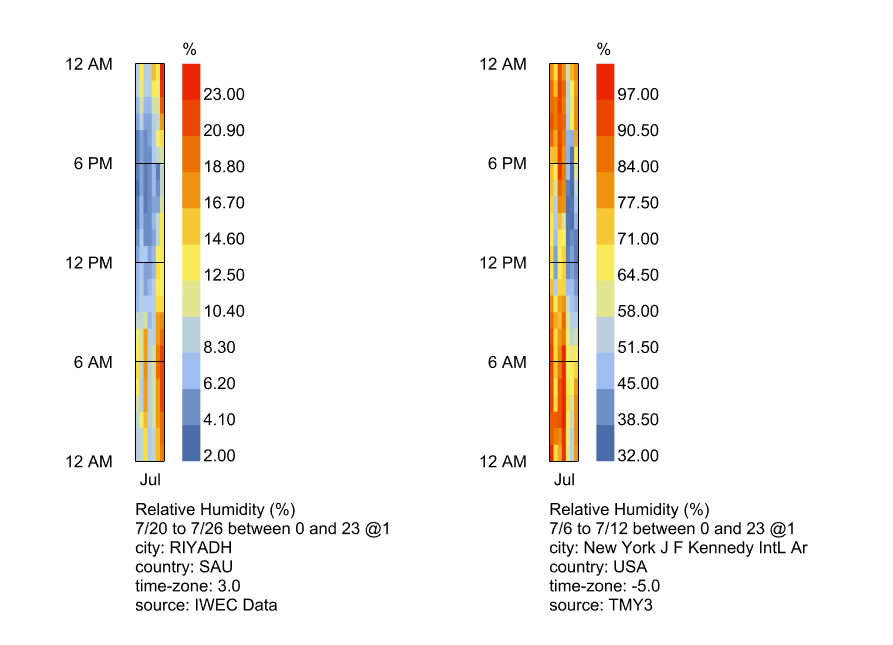
Please find below the RH for both the places below. The relative humidity for Riyadh is around 25% whereas NY is around 100%
Please find below the GH file
outdoor_comfort_under_a_tree_variations.gh (221.7 KB)
The simulation data can be downloaded from here
Please advice on how could i have simulated this better.
Thank You
Hi @anujm1ttal,
Just from reading your message and not diving into the analysis and results my theory would be that the similarity between asphalt and grassy lawn is due to you looking at average temperatures for the whole week.
My guess would be that the asphalt would give much higher UTCI values during the day when it’s been exposed to direct sun, but then may also cool off significantly more overnight due to sky cooling and other factors.
I could definitely be heading in the wrong direction here, but hopefully a useful pointer will be to look at the hourly results to better understand what’s happening.
As @Erikbeeren has said, sometimes you really need to dive into the physics behind the simulation and investigate how your inputs relate to that to understand why your results are what they are.
Cheers,
Charlie