I’m running annual analysis to find peak values of solar radiation. With honeybee i can run the radiance simulation on 500pts in roughly 20 seconds. However, I’m using 5 minuttes to load the annual data into grasshopper.
I think the grasshopper (1 core mode) way of reading these annual results is a bottleneck here. I was wondering if its possible through python or an external part of honeybee to make some statistics on the annual datas.
Such as:
Num of hours above a certain value (returns one value per point)
Max value (returns one value per point)
Date of the max value (returns one value per point)
75% percentile of max value (returns one value per point)
As it is now, people use the accomulated annual data to get an idea of energy usage, but I think we need to include these peak values to get an idea on if our ventilation/cooling system is good enough. I know Energyplus can do this simulation, but looking at pure solar gains is good for early phase and facade designs.
How do you load annual data into Grasshopper? 5 minutes sounds like so much for 500 points. Are you using “Honeybee_Read All the Hourly Results from Annual Daylight Study”?
In any case once you have it in Grasshopper you can run all the post processing pretty fast. I mean you don’t need to import them every single time. Is that make sense?
A GH file would be really helpful to understanding what you are asking here. Are you talking about a simulation of radiation for peak cooling or are you talking about illuminance values from an annual daylight simulation?
Sorry there was some other things also in the calculation. But here for 800 points I’m using 1.7 minutte just loading the data into GH. In the meanwhile I’m only using 15 seconds on the simulation itself. I think using some external script that can run multicore, we should be able to speed up this process. I’m looking for the peak radiation in each point (w/m2).
So if this “external script” could find the max of each point before importing to mono-core grasshopper framework. That would be great. Postprocessing in grasshopper is also quite slow with 800x8760 values.
I’m digging through the GH/Ladybug discussions and came across Mathias’s question, which is exactly the question I wanted to ask. Is there a way in Ladybug (rather than Honeybee) to output the peak solar irradiation values on each analysis point on a surface rather than the annual cumulative solar irradiation? The cumulative value is great for understanding PV output, for example, but for early phase facade design, having this visual of peak solar reduction from shading devices, for example, is a very useful capability. If you have any further thoughts on this, I’d be keen to hear them. This was one calculation that was quite straightforward in Ecotect, so I’m hoping it’s not too difficult to implement in Ladybug if it hasn’t been done so already. (Sorry, I don’t have a GH file to share!)
I’ve found a way to do it through python and numpy+pandas.
You need Mahmoud’s gh_cpython plug-in and to install the two mentioned libraries.
I can upload my script shortly with a guide. This thing can load results in a few seconds instead of several minutes (and avoid a lagging GH canvas as it caches all the data). Maybe during this weekend
This is so great to hear! Thank you for letting me know. If you don’t mind uploading your script and guide once you get a chance, I would love to try it out.
This is the single most important feature that I miss in Ladybug, a fast way to determine the maximum irradiance on a given part of the year, for example summer. This could be used to determine thermal comfort.
@MaxTillberg, You should check Honeybee[+] radiation sample file. It has been addressed already and it also breaks down the direct and diffuse components which can be useful for post processing!
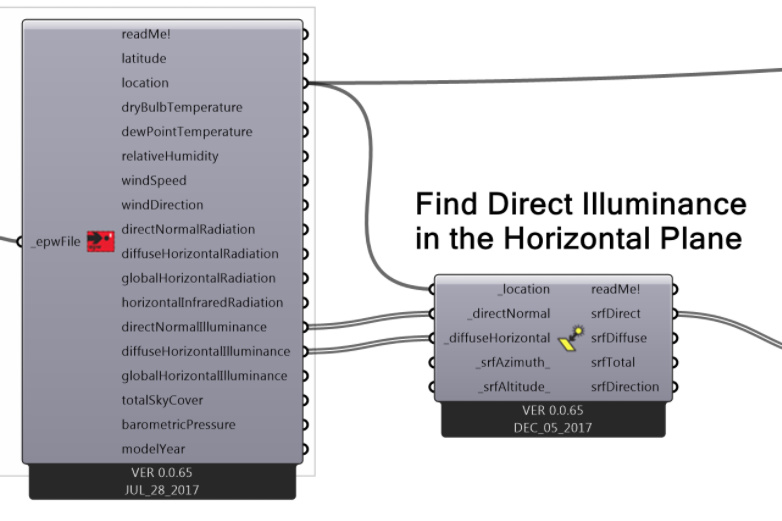
This component is made to help you quickly calculate the hourly solar radiation or illuminance falling on a surface facing any direction (or any combination of altitude and azimuth). The only caveat with this component in comparison to an actual daylight or radiation simulation is that you cannot account for context geometry (either reflections or direct/diffuse sun blocked). However, it is very fast (< 1 second for a year’s worth of radiation) so this may be what you are looking for.
See here for an example file using the component to calculate ASE.
-Chris
I’ve got my little snippet to work and runs fast-is compared to raw grasshopper instructions. This is a beta and there may be bugs with it. Let me know if it works and if not, I’ll try to guide you through it.
Be warned that this runs on GH_Cpython instead of GH_Python. This is because in Cpython I can point it to a manually installed python installation and include libraries such as NumPy and Pandas. These are very good for handling large amounts of data. I intend to make a version that works for “regular” GH_Python, but I lack the skills and I think it will be slower.
Right now it parses ill files at a rate of around 1000 points per second.
Installation guide:
Get Anaconda:
Install python 2.7 in anaconda ( in terminal or cmd write: conda create -n py27 python=2.7 anaconda)
activate the py27 environment. (on windows in cmd write: activate myenv )
install NumPy and Pandas (remember #3 must be done first!). Write following in cmd:
conda install bumpy
conda install pandas
in both cases write y to install.
when starting up grasshopper after installing gh_cpython, it will ask you which python installation to use… point it to C:\Anaconda\envs\py27\python.exe or C:\Anaconda\python.exe depending on installation. can’t really remember.
Then it should work!
Find my script here:
screenshot
I apologies if it is too much work, I’d love to make it more simple…
Hope you guys can get it to work and a happy new year!
/Mathias Sønderskov Nielsen
@chris I could use some help getting the hydra uploader to work and pop up in the hydrashare overview. I’m new to GitHub and tried to follow the guide on https://github.com/HydraShare/hydra/wiki
@chris any thoughts on changing the full LB/HB suite into GH_Cpython? to me it seems faster!
Technically we can do it pretty easily but I’m not sure how stable the CPython component is. It can also solve a lot of other issues we have with IronPython and its limitations.