This is a good question, @Alapeace , though you’re actually the first person I know of to ask for this in the LBT plugin. I realize that the following is a lot more roundabout than Legacy but the best way to do this right now in the LBT plugin is to process the neutral_temp output of the LB Adaptive Comfort component into a data collection that gives you the range of adaptive comfort, which you can then plot on the Monthly Chart. Here is a sample:
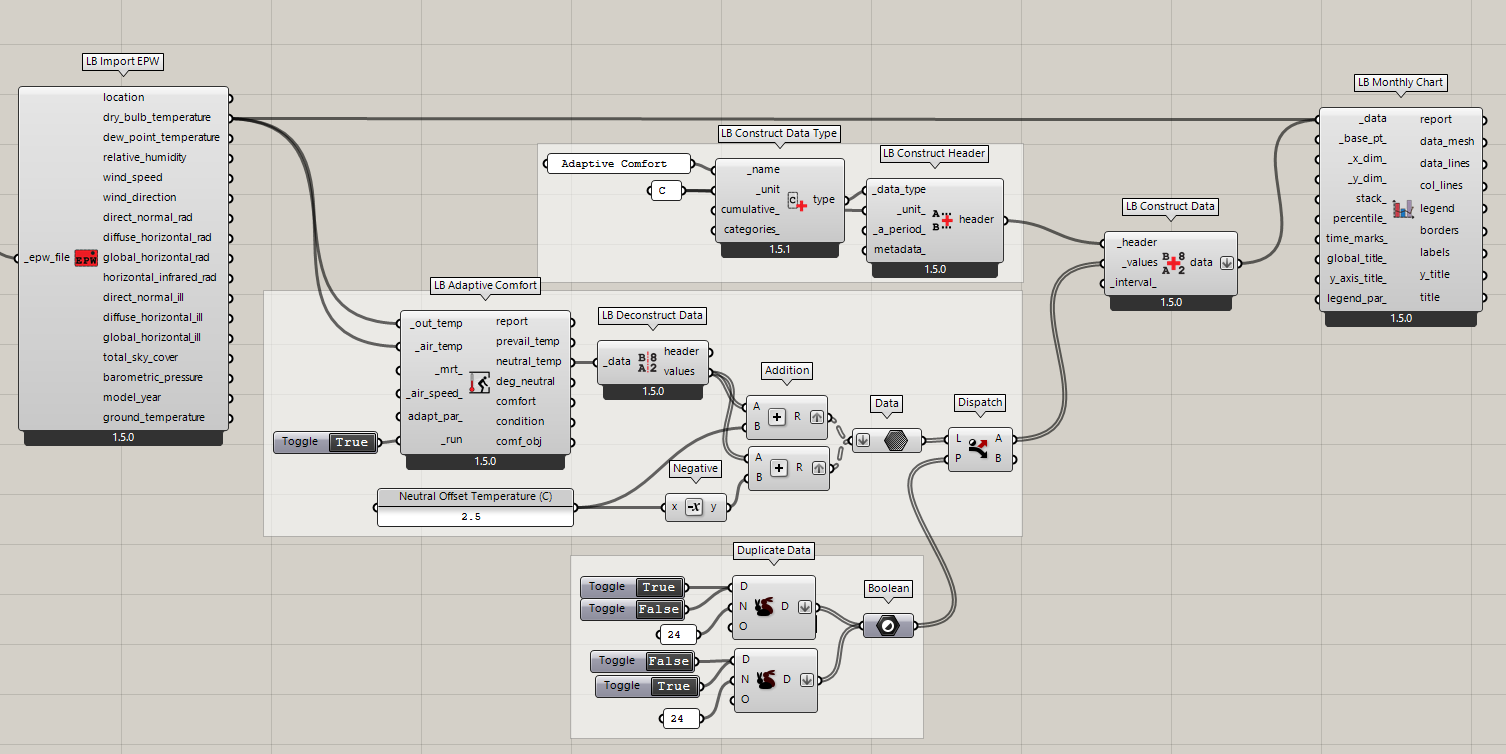
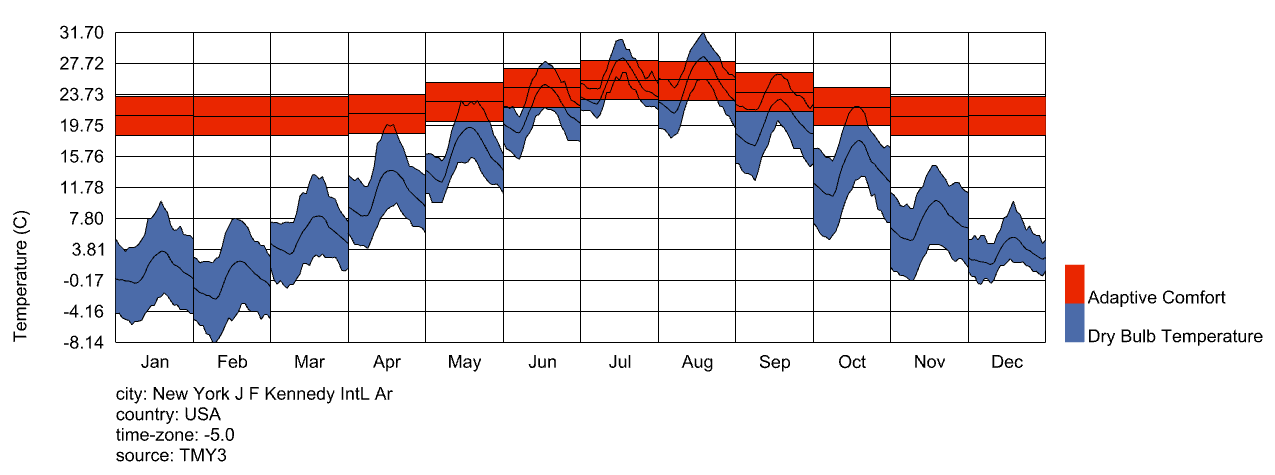
AdaptiveComfort_MonthlyChart.gh (32.8 KB)
Or, if you want a sample that looks a little more like Legacy, you can do this:
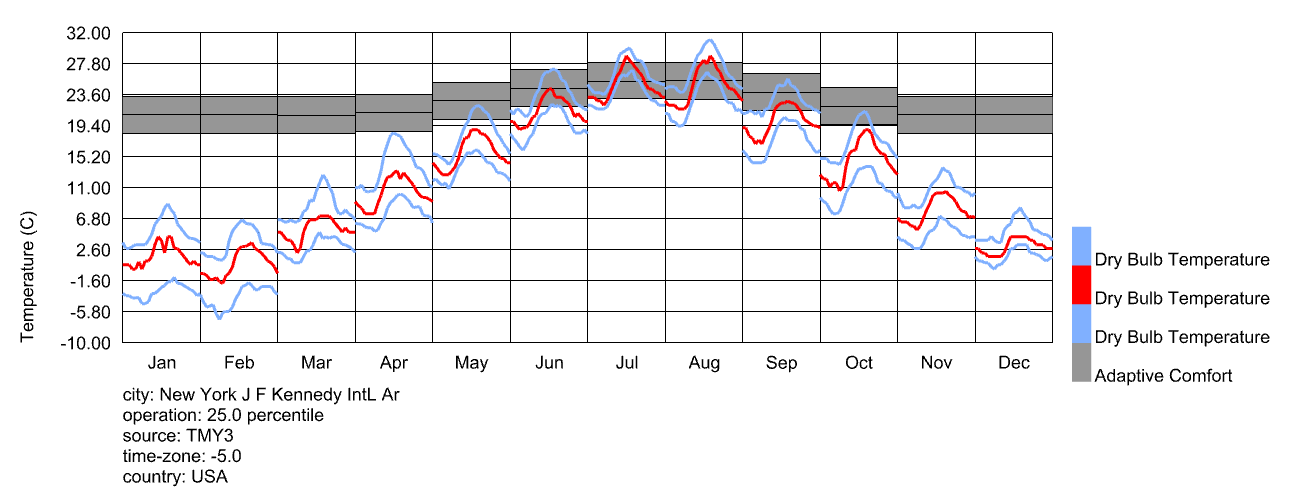
AdaptiveComfort_MonthlyChart2.gh (46.5 KB)
If this is something that multiple people want, then maybe I can add a dedicated component for producing these data collections. But I feel pretty strongly that the Monthly Chart component should be very generic and there shouldn’t be an input for a specific data type on it like temperature.
If more people say that they need this, I’ll add a dedicated component or at least put together a sample that does everything with a single GHPython component instead of several native Grasshopper components.