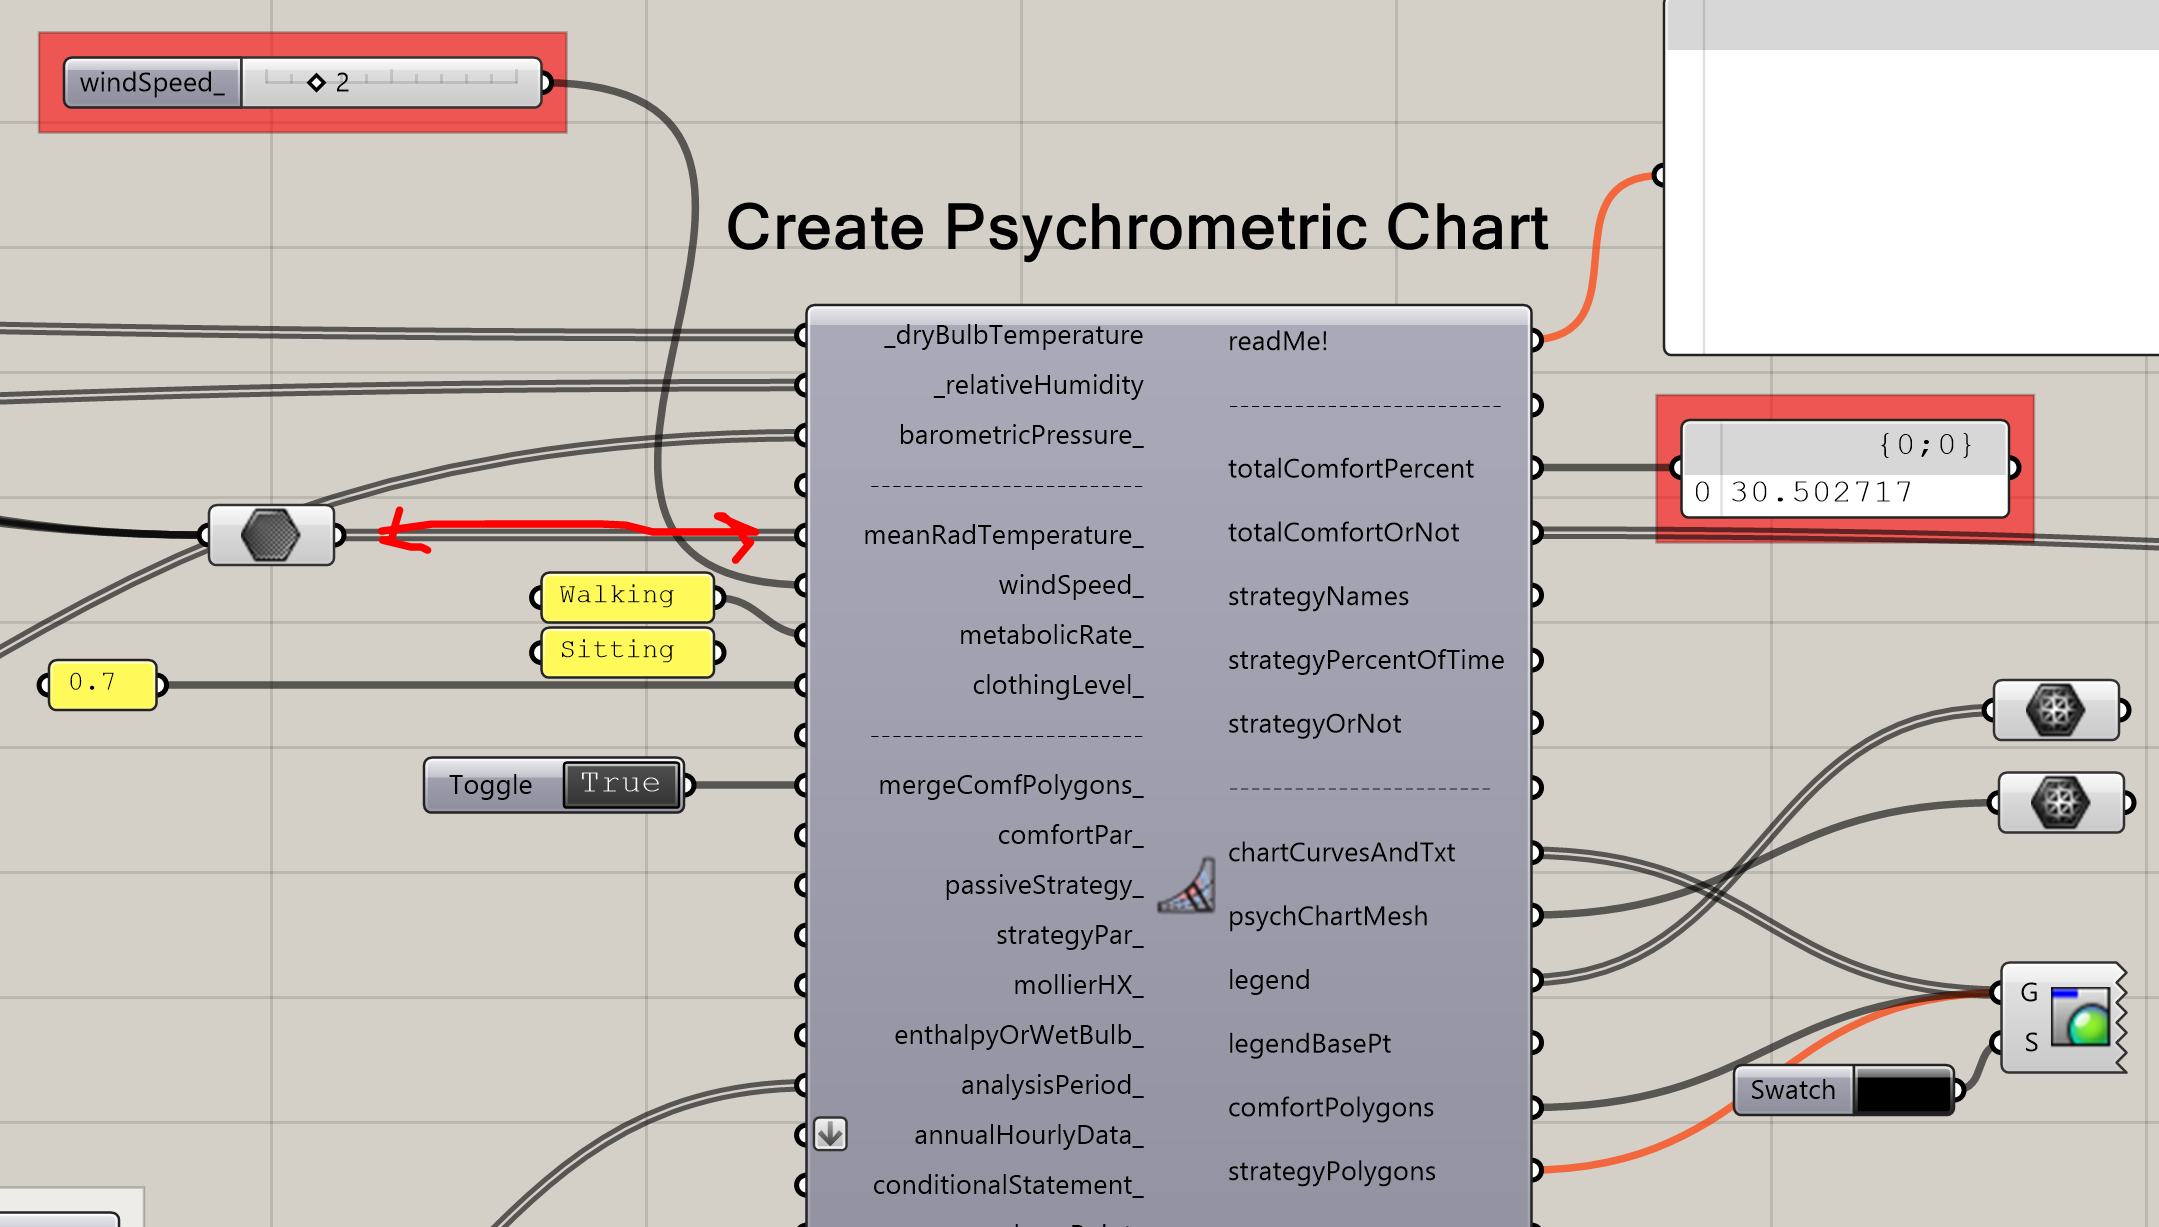
So I am trying to investigate strategies for outdoor thermal comfort and trying to push the Psychrometric Chart for this.
I am analyzing the summer time in Kyiv, and previously measured Mean Radiant Temperature for asphalt material (averaged).
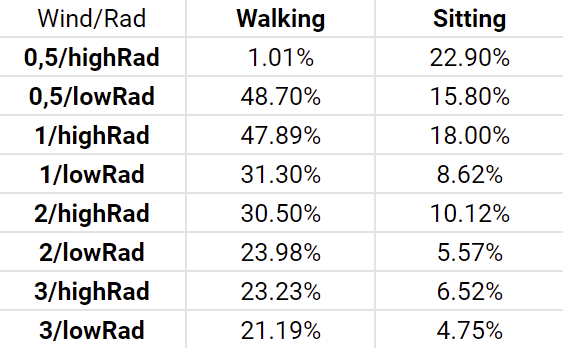
So I am trying to predict two situations: 1) (highRad) when the outdoor surface temperature is hot; 2) (lowRad) when it is same as the air temperature; + different wind conditions.
So I am plugging in the mean radiant temperature for the first case, and unplagging it for the second.
The thing that put me into a doubt is that I was thinking that removing the Mean Radiant Temperature would improve the otdoor thermal comfort, but the chart shows me the opposite…
Can anyone help me to understand the results? Perhaps I am doing it wrong?
Bellow are the values for the Total Comfort Percentage:
Also, I noticed that when the mean rad temp is plugged in - the bottom scale shows Dry Bulb Temperature, while the opposite - Operative Temperature. (This is confusing)
I’m starting to put together the psych chart for the new LBT plugin and I think I’ll add an option for plotting a UTCI comfort polygon on the chart. But @AbrahamYezioro is right that the legacy psych chart only supports a comfort polygon for the PMV model, which has proven to be a very poor indicator of comfort in outdoor conditions and in buildings with natural ventilation. It’s really only suitable for conditioned buildings.
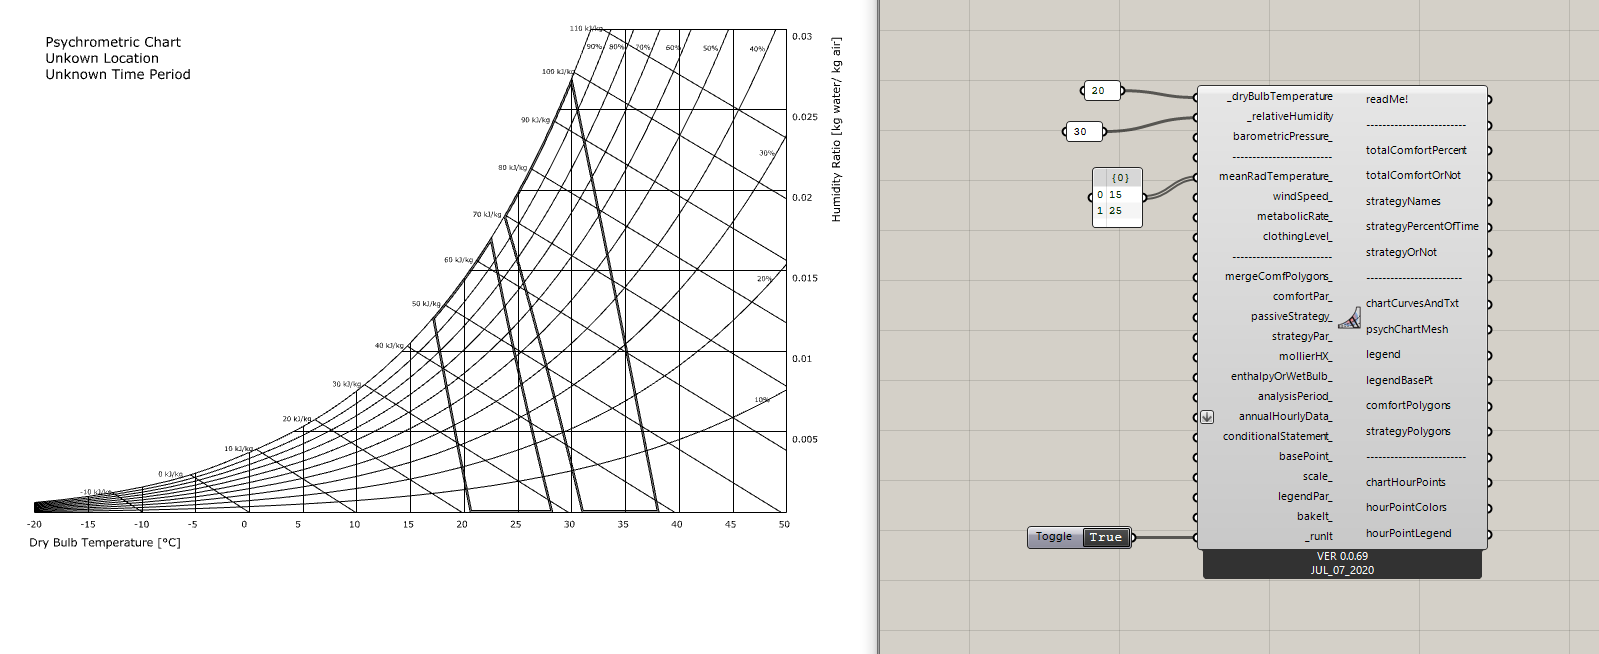
FYI, if you are using MRT with the psych chart, you should only plug in one MRT value. You will get multiple comfort polygons if you plug in more than one value:
It still isn’t added yet, though this method here in the source code gives essentially everything that is needed to calculate it. I was planning to add support for an official UTCI comfort polygon component along with the adaptive comfort chart sometime in the next few months.