Hello everyone,
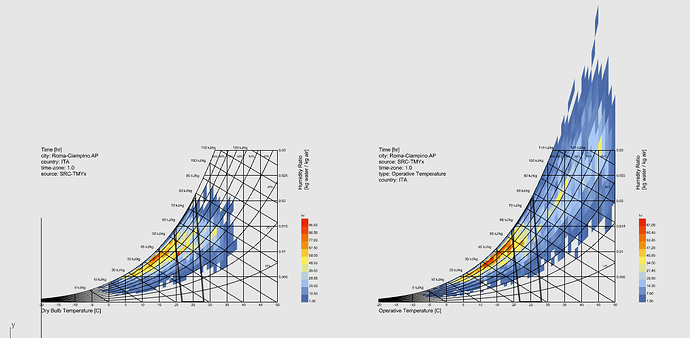
I’m back with another question. I have some doubts about the results I’m getting from my psychrometric chart when I use the operative temperature on the x-axis instead of the dry-bulb temperature.
As you can see from the image I’ve attached, the hours appear far outside the graph, which makes it seem like there is an excessive amount of humidity. However, in the chart using the DBT, the hours behave in a more “normal” way.
Psychrometric chart w operative temperature.gh (108.1 KB)
I have read a lot on this forum before writing this post, and I have used some scripts I found here from these discussions:
Unfortunately, my knowledge is limited, so I am unable to determine if everything is correct or if there might be an error.
Is anyone able to help me with this? Thank you so much
