It looks like we’re still a little further away than I thought about this. Let me first summarize what we seem to agree on and then we’ll see if we can come to a consensus about a couple of things that are necessary to implement shade as a strategy.
What We Agree On
- We can represent “Shade” as a strategy on the Psych Chart using a line (in lieu of a whole polygon).
- Adding the Shade strategy should come with another data collection out of
polygon_data showing hours when the shade is relevant.
- The addition of shade probably shouldn’t affect the
total_comfort all that much (though I think there’s still a lot of specifics to work out here).
What We Need a Consensus On To Implement Shade
1. Does a psych chart strategy represent the hours that are made comfortable by the strategy or the hours helped by it? Alternatively, does it matter that we enforce a consistent definition for what a strategy is?
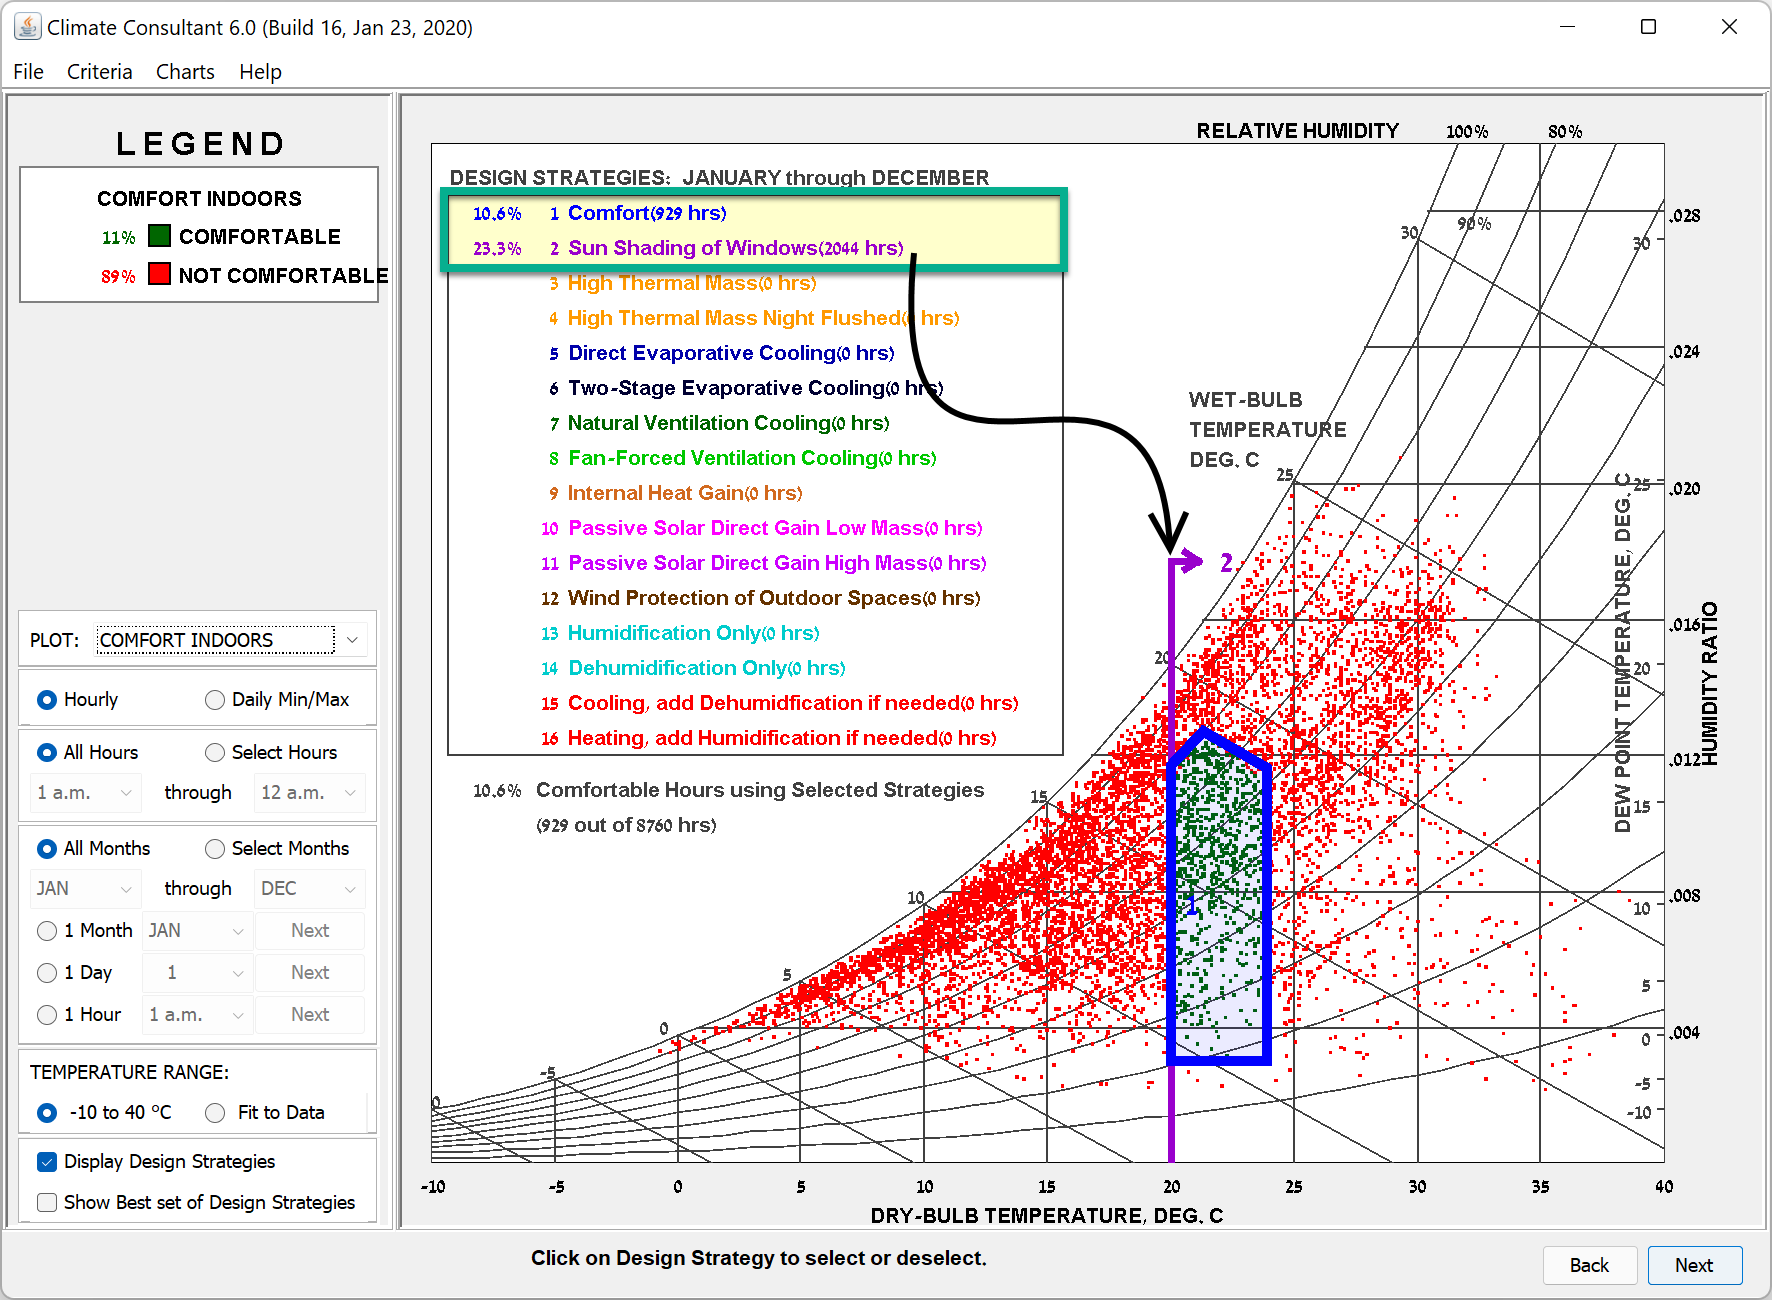
So far, all of the current strategies that you can plot in the LBT plugin show the hours that would be made comfortable by a given strategy. That is, implementing the strategy in a manner that obeys the assumptions of the Passive Strategy Parameters would move the point from where it currently is on the chart to be inside the comfort polygon(s). We were using “Occupant Use of Fans” as a means to demonstrate this since the polygon currently shows the hours that would be made comfortable by increasing the air speed to the _fan_air_speed_ of the “Passive Strategy Parameters” (default value is 1 m/s). However, increased air speed is helpful for occupants any time that they’re hot and they have sweat to evaporate. Granted, this air speed might not be enough to lower PPD to less than 10% and put conditions inside the comfort polygon. But it will lower PMV to something closer to zero/neutral from where it originally was because increased air speed leads to increased sweat evaporation. So it’s helpful anywhere on the right side of the chart. Maybe the only case where increased air speed wouldn’t be helpful is if the air temperature were warmer than the radiant temperature but this isn’t a nuance that we can capture on a psychrometric chart that only has one temperature axis for operative temperature.
All of this is to say that many of the strategy polygons would change significantly if we wanted them to show that a strategy can help instead of when it makes occupants comfortable. Granted, I could possibly be convinced that it’s not important to have a consistent definition for what a psych chart strategy represents. But I just feel that we have an opportunity to keep things consistent here and so I don’t really understand why we should make an exception for Shade and not some other strategies.
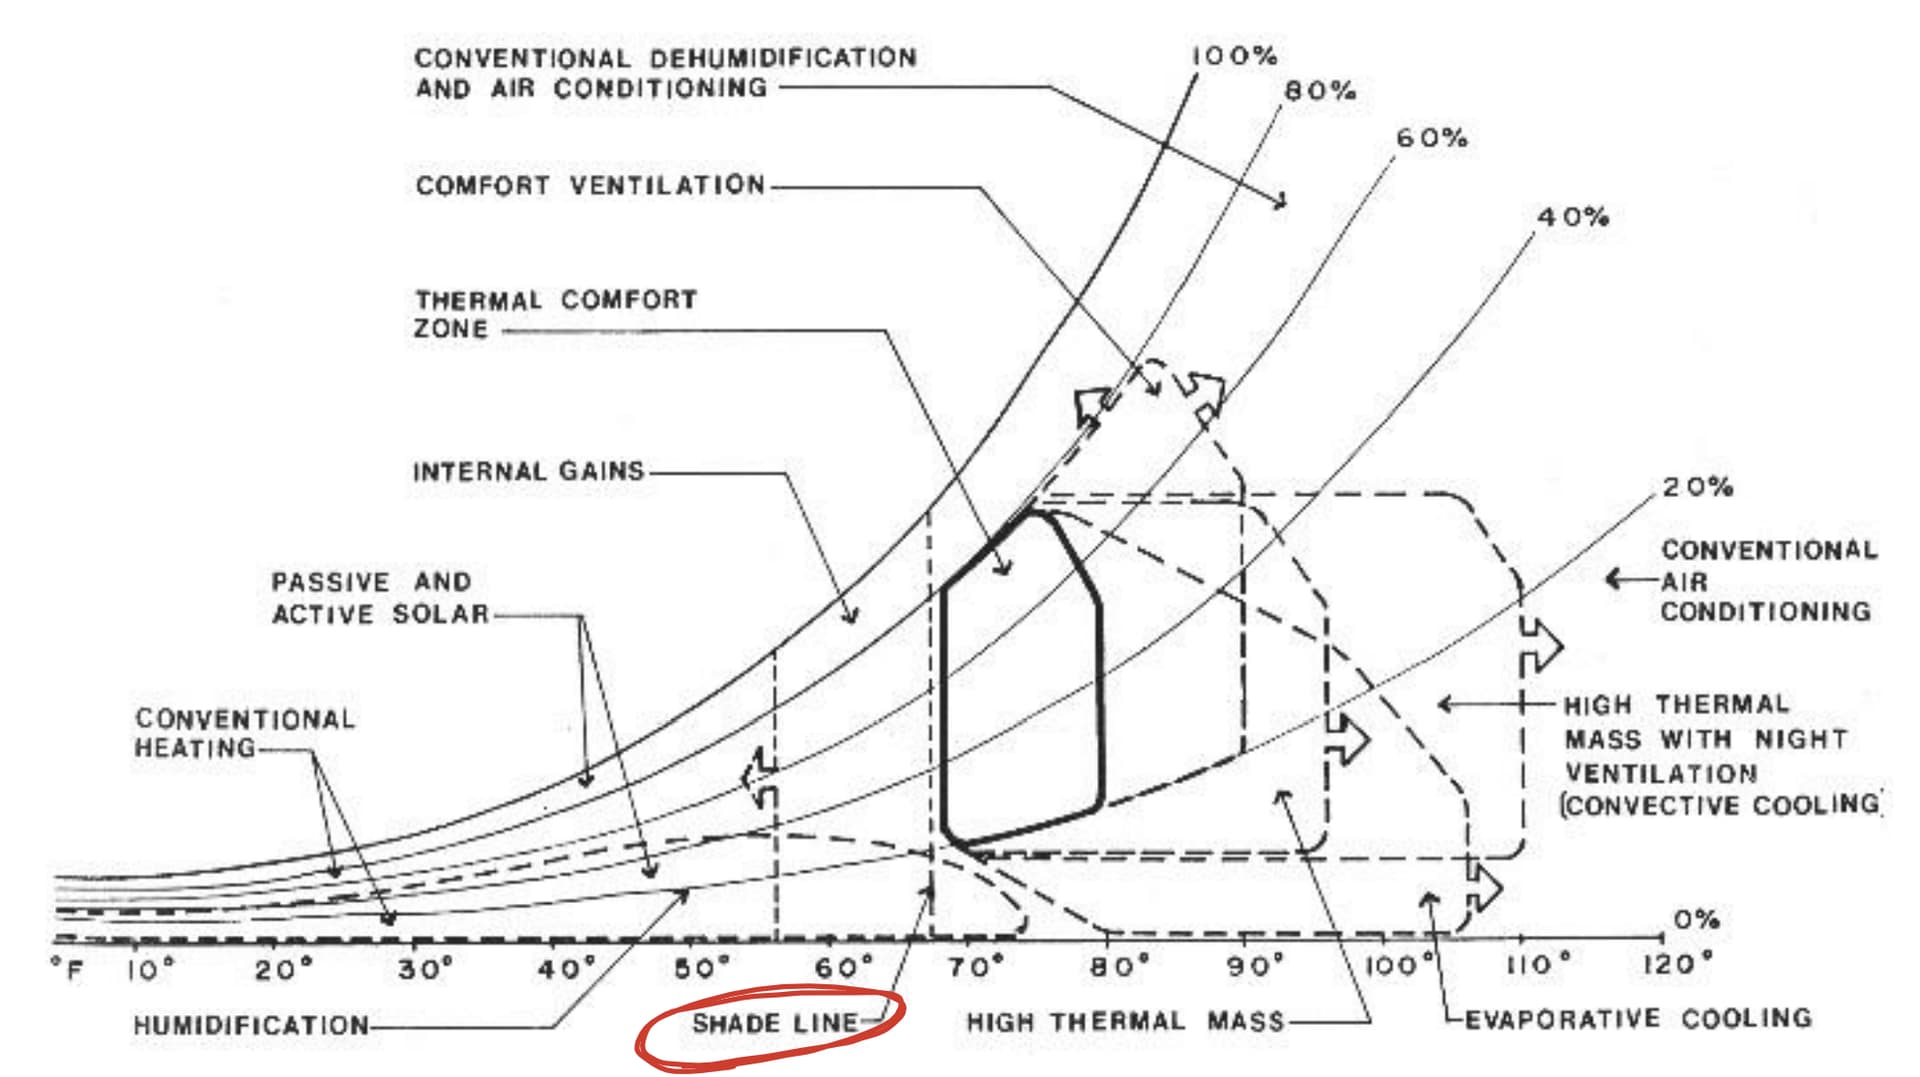
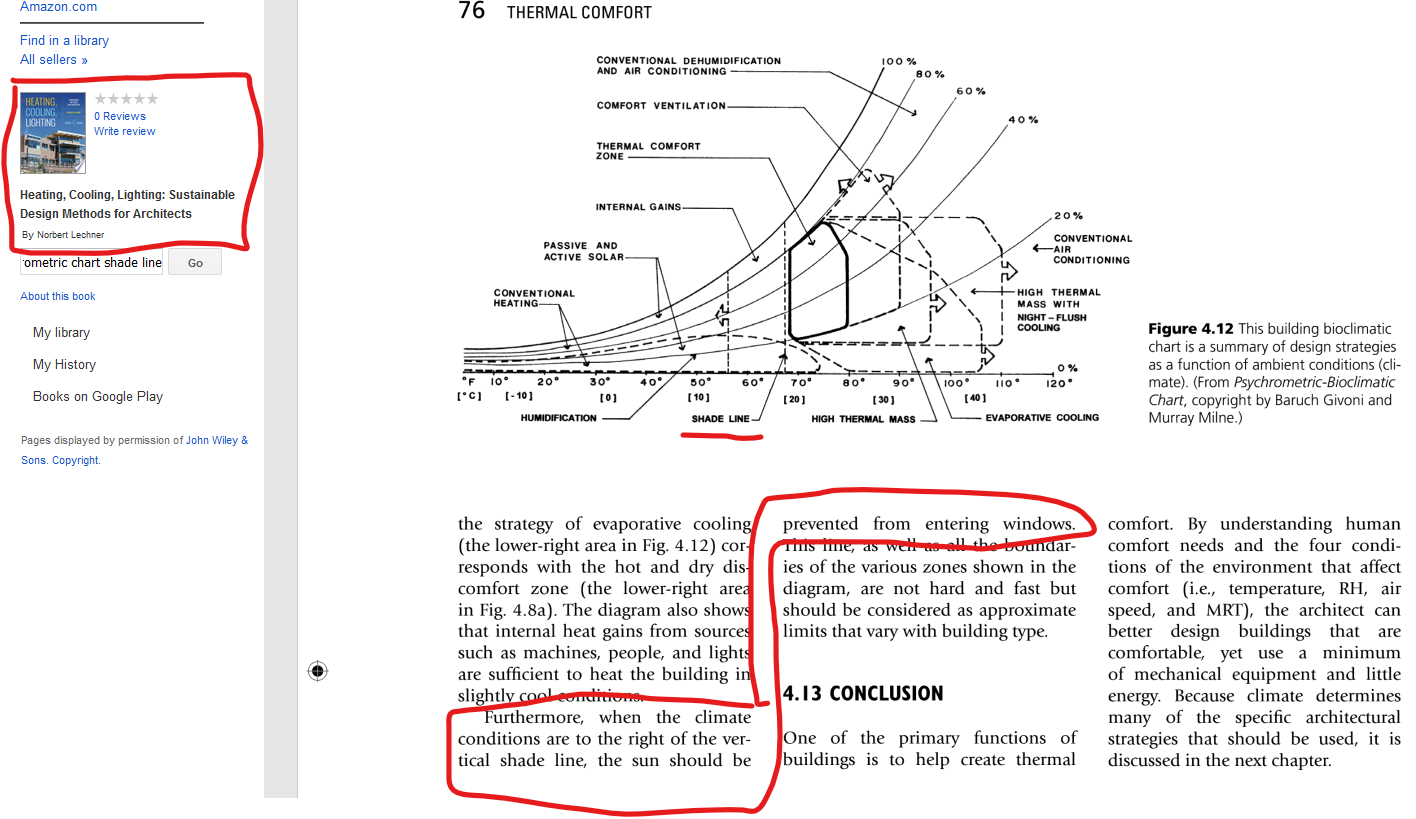
2. What type of shade does the Shade Line represent? Is it Shading on a passive building in which the occupant sits? Or is it more like a beach umbrella that directly blocks sun falling on the occupant?
I think a lot of our disagreement about where the shade line is might come down to this. I keep thinking of shade as something that is applied on top of the other strategy polygons and that these other strategies together represent a hypothetical passive building in which the occupant sits. So the shade is essentially like an awning or overhang on this hypothetical passive building. This is why I only want “Shade” to affect the hours that are already inside the existing comfort/strategy polygons since these strategies effectively need a low solar load in order to work correctly. It’s also why I feel the shade line should be at the building balance point since this is the temperature at which the sun switches from being a benefit to the building (Passive Solar Heating) to something harmful (Shade). And the logic follows that, even if it’s 15 C outside, conditions within an insulated all-glass greenhouse blasted by the sun can be so warm that it’s just not comfortable for people.
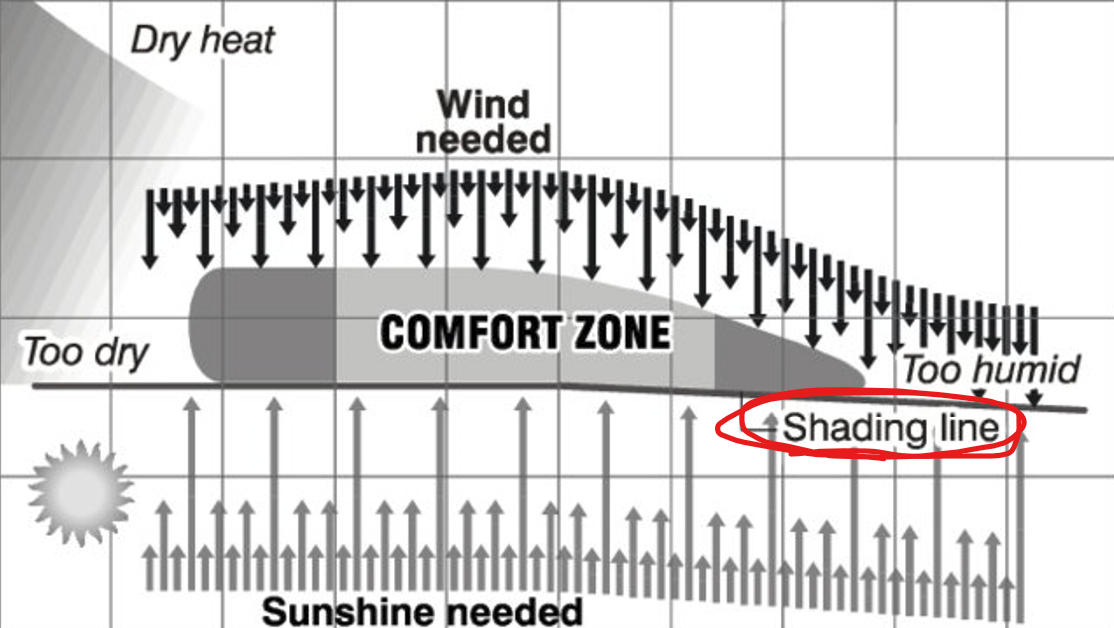
I have to imagine that this “building shade” interpretation is not what the original authors of the “Shade Line” thought. I’m guessing they were imagining that this Shade was more like a beach parasol that was applied directly to the human and not the the passive building in which they were sitting. And so they put the line at the “human balance point” of the comfort polygon instead of the “building balance point”. Granted, I can understand the appeal of either interpretation but I struggle with the fact that we know today that sitting in shade vs. sun has a huge impact on perceived temperature. So much so that the “delta C” you experience by sitting in the sun can easily change you from being too cold to too hot, skipping over the whole comfort polygon in the process. It’s just a tough thing to represent with a strategy on the psych chart and it’s the type of comparison that’s better done by adjusting the temperature plotted on the chart (as I did above).
I guess there’s also the question of whether these strategy polygons are trying to help us design passive buildings or are the just reiterating something simple that we already know like “people shouldn’t sit in the sun if they’re already comfortable or hot.”
Thinking this over, maybe this isn’t as black and white as I originally made it out to be. Maybe we could just change where the shade line is based on the other strategies plotted on the chart. So, if “Capture Internal Gains” is plotted on the chart, we can show the shade line at the building balance point. Otherwise, we can show it at the human balance point on the lower part of the comfort polygon. What do you think?
Miscelaneous
On another note, I forgot to answer this earlier:
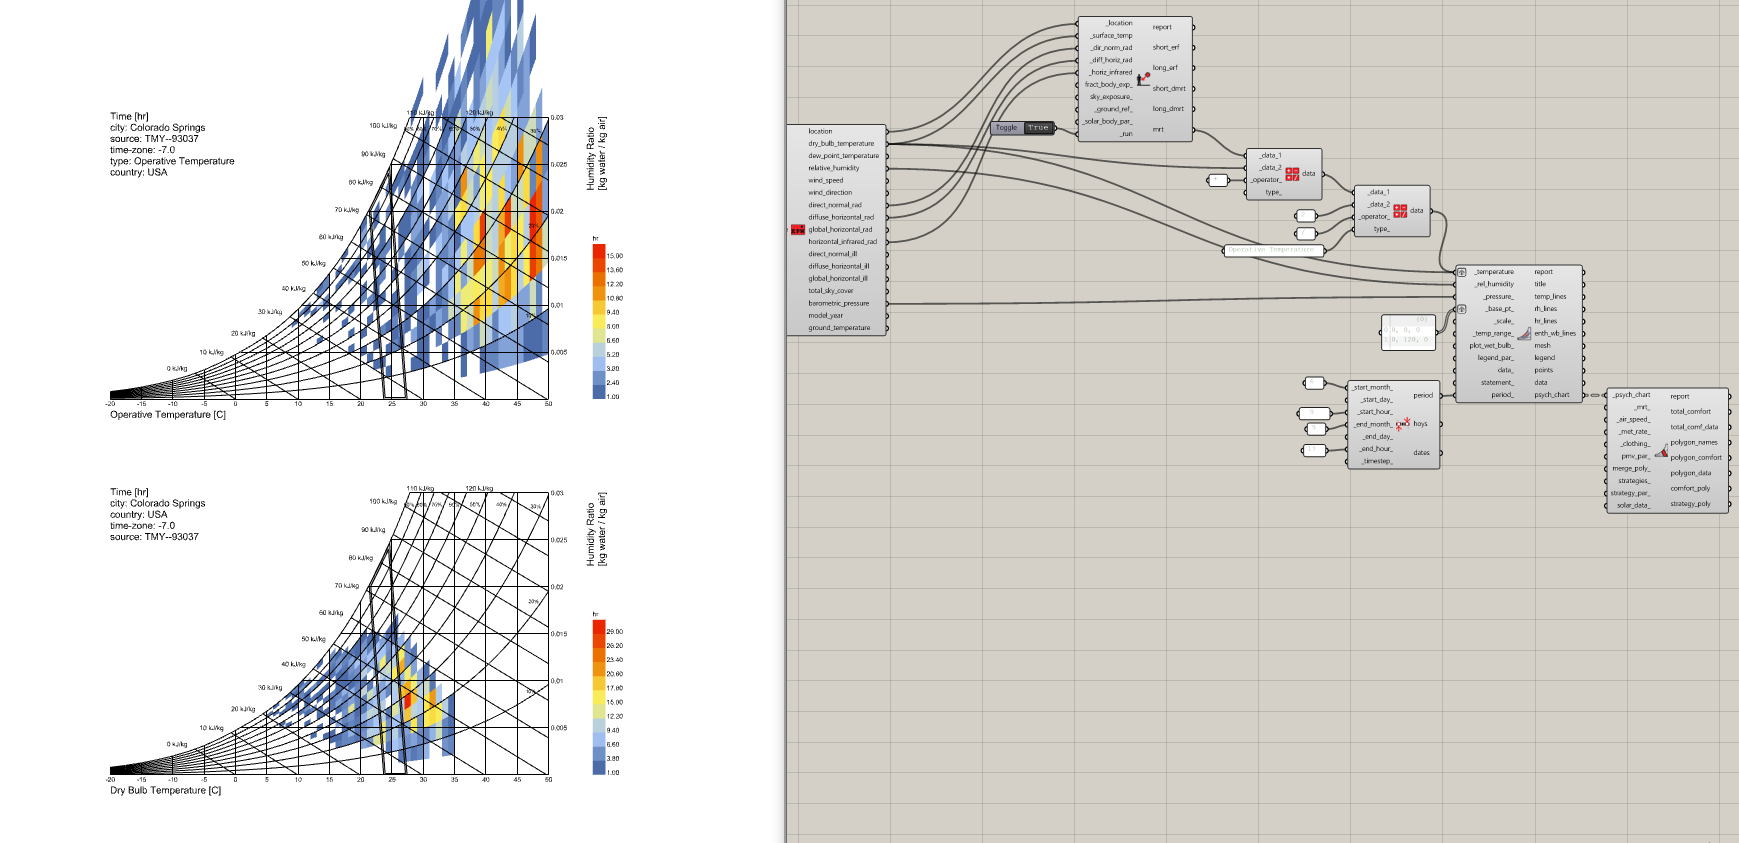
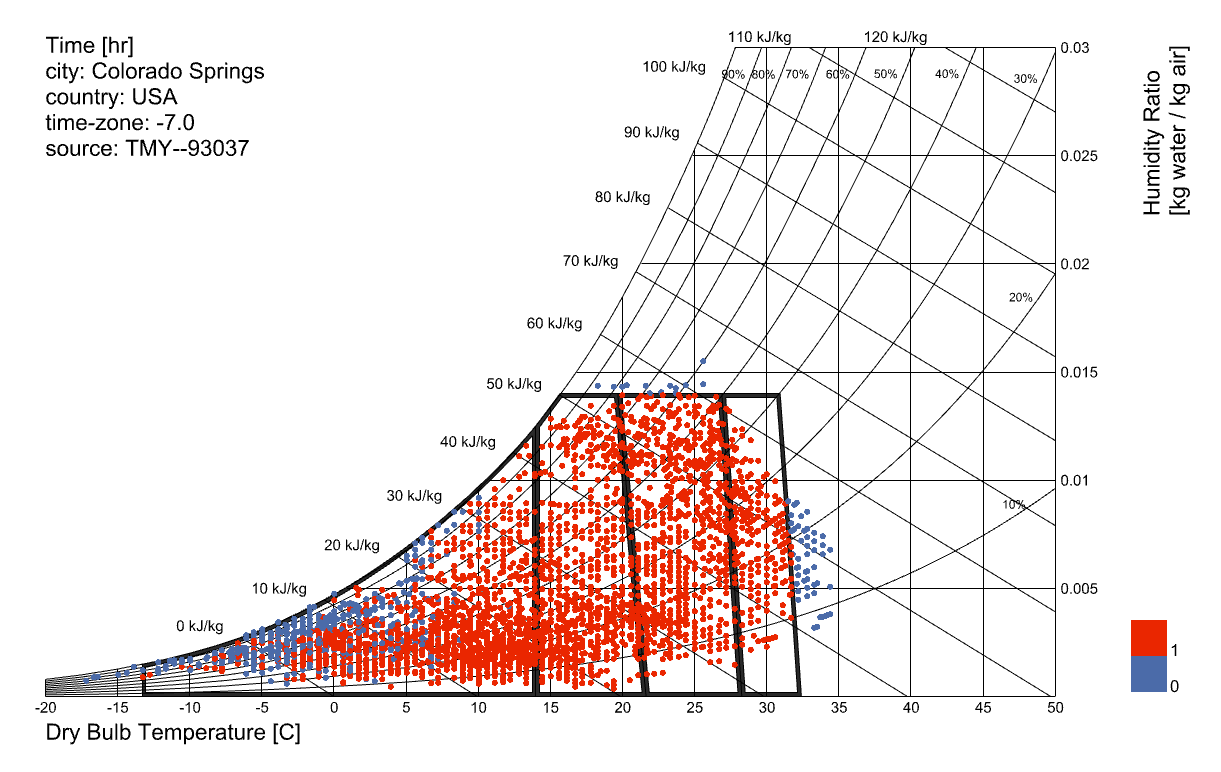
Check out this sample file for what I mean. You have to plug in solar radiation data to the solar_data_ input of the PMV Polygon component in order to plot a “Passive Solar Heating” strategy polygon (otherwise the component turns red). You’ll see in the sample that this solar data can be for any orientation of windows on the theoretical passive building that’s being assumed under the hood of the strategy polygons. You’d just have to use the LB Directional Solar Irradiance component to convert the EPW irradiance components to be irradiance on a window surface facing any direction you want. This solar data is used to determine which particular points inside the “Passive Solar Heating” polygon are actually comfortable since you can see that not all of them are this way:
The assumption is that, if a given hour is too cloudy, then passive solar heating doesn’t make the hour comfortable. I was thinking that shade should have to abide by a similar rule.