I was testing the sample files (annual_daylight) and I decided to benchmark the sample file with a much lowered grid size, to increase the load. CPU count was set to 5 as I have 6 physical cores (or 12 with HT, but that’s not the topic).
With 44,770 points and -ab 2:
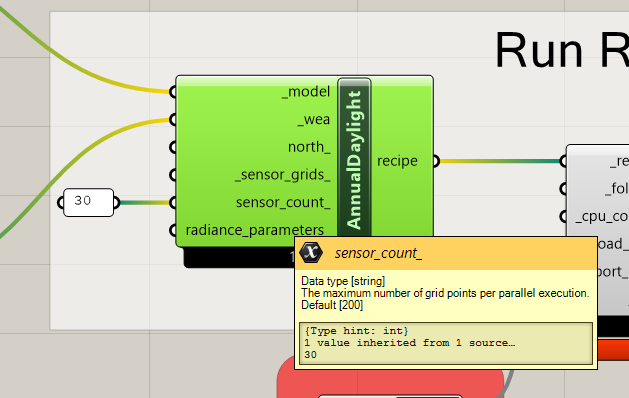
sensor_count = 30 --> 55min simulation (this is default in the bundled .gh file)
sensor_count = 200 --> 12min simulation (this is LBT default)
sensor_count = 1000 --> 6 min simulation
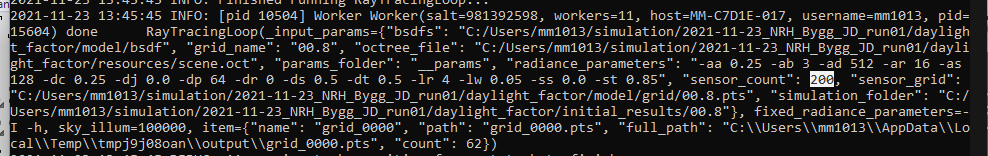
sensor_count = 8954 (points/cpu count) --> 6 min simulation
I’ll suggest to have the default set to somewhere around points/cpu count
Yes, the overhead of subdividing the grids into smaller chunks can come to dominate the simulation runtime if it’s not properly set. I think your suggestion is a good one but it’s not the easiest to implement in a way that always works. Let us think about it and maybe I will implement a hack to do it for the time being, which we will have to replace with a “correct” way to do it later.
Hi @Mathiassn, in case you only have one sensor grid the logic is a straightforward as you mentioned. You basically want to distribute the sensors between the CPUs equally.
However this can get complicated quickly if you have multiple sensor grids with different number of sensors. This is a common case in the full building with different rooms with different size. That’s why I think this is something that the user should set up instead of us trying to automate it.
You should also consider the post-processing step in the overall optimization. The most efficient option for multi-processing is to merge all the grids initially and then break them down between CPUs equally. But that will add an extra step to bring them back again and align them with sensor grids eventually. It’s something that we did in Honeybee[+] with the idea of pushing the results to a database so we could quickly put them back together but that didn’t scale well using sqlite. Using other databases adds complexity to installation and cost in cloud solutions. There are still options that we can try but what I’m trying to say is that it’s not as simple as dividing the number of sensors by the number of CPUs.
I sort of agree, but it maybe calls for different workflows if you need a quick study or a large scale study.
The merge part sounds ok for smaller workflows imo. (As was done in legacy)
It just adds unnecessary complexity for the users (specially the novice ones who want to run small studies). I would aim for a default value and an override.
but I find this discussion important and very related.
@Mathiassn I think your conclusion above is holds true when you are running low accuracy calculations (ab 2). If you were to increase the ab’s to 6, I think your results would be very different, as your simulation would be dominated by the most complex piece of the calculation, which would take way more time.
I’ve done the exact same test as you, and ended up with very different results. For my example, the sensor_count of 200 reduced the speed by 50%. See here for more info:
Unfortunately, I’m unable to reproduce those tests as the sensor_count is gone, and that leads me to my question: why is that?
In the latest version of the recipes, there’s a min-sensor-count that is under the hood, @Mathiassn . That’s probably what you are seeing there but it’s different than the old sensor-count input and changing it will likely just make the simulation less efficient (hence, why it is not exposed).
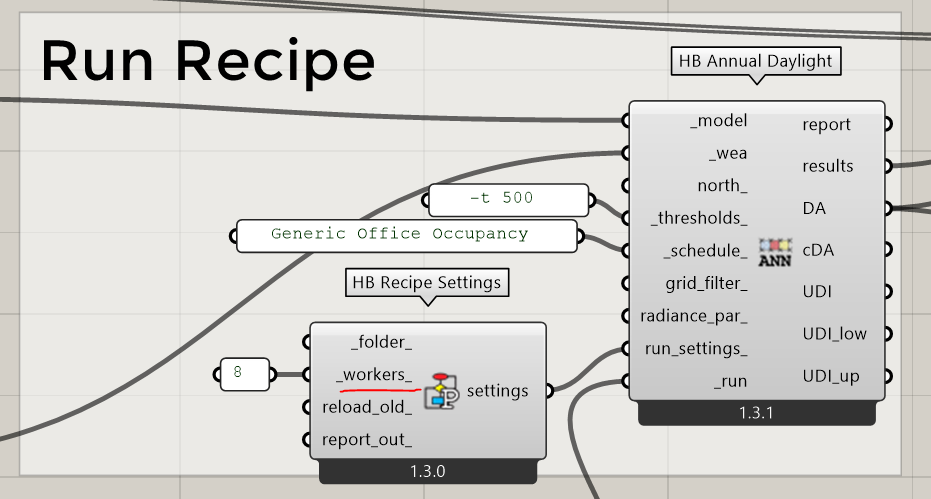
You should find that the defaults of the latest recipes get very close to the “optimum” scenario that you described that the top of this post @Mathiassn . The grid-splitting now aligns with the number of workers/CPUs specified. You can still adjust the number of CPUs that get used in the simulation using the _workers_ if you really need to control the usage of your machine:
… but the default is to use one less than the total number of processors available on your machine. So just accepting the defaults should give you close to the best performance that’s possible on your system.
Hi Chris this sounds great. Glad you got it optimized
I still have a feeling though that running 10 smaller grids takes much longer time than merging the points together into one grid.
In my current workflow i actually merge them and divide them later post-simulation.
My tests were on heavy geometry and low radiance settings just for testing overhead. I’ll have to redo them and provide some numbers, I know ;-).
If you have one of those rare cases where it’s preferable to not parallelize things at all, then you can always set the number of _workers_ to 1. With the new recipe format, setting this to 1 will ensure that the recipe runs everything with a single sensor grid and then splits them up at the end. But I think this case where parallelization hurts more than it helps is rare and, as you said, it requires a lot of geometry and very low parameters.
I think the parameters that decide the parallelization should be dependent on number of points and numbers of available CPUS. And not room/grid count, since this adds extra unnecessary parallelization…
UPDATE:
Just did a benchmark on a 64 core pc and proved my own hypothesis wrong, @chris ! I owe you one.
Merging all 1700 points into one room: 14 minute simulation
Running with 68 rooms (same sum of points ofc): 14 minute simulation.
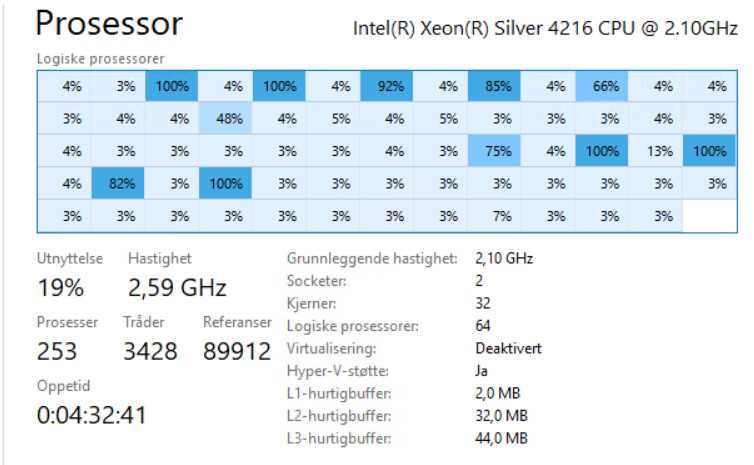
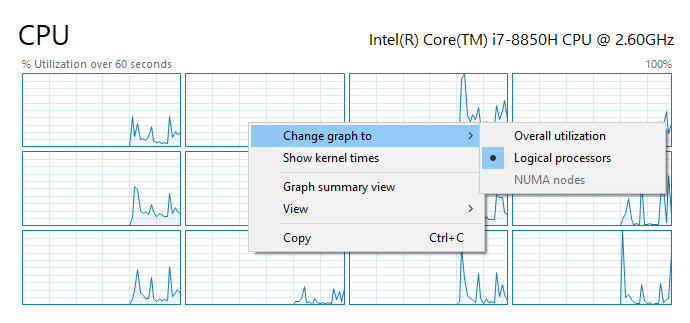
However parallelization did not look too good (this screenshot was taken 5 minutes in).
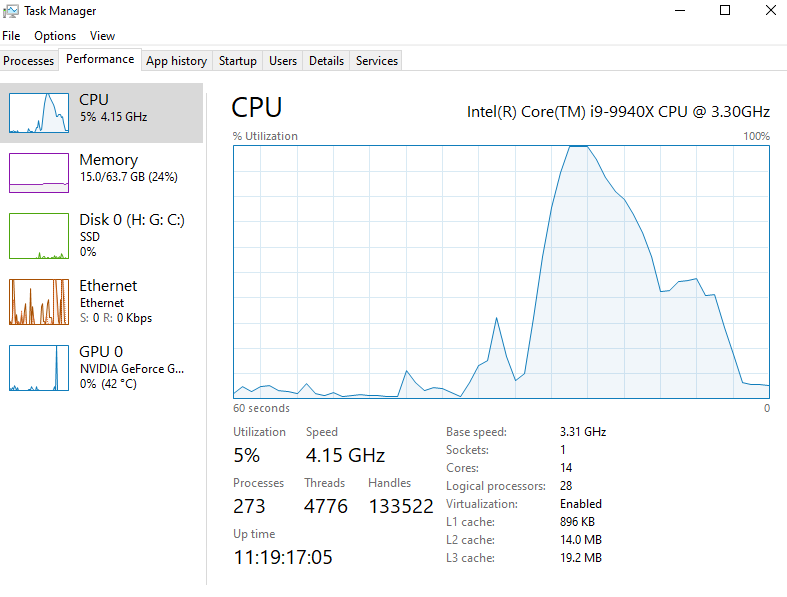
Yes, that’s exactly how we do the parallelization now after the update. And your tests seem to have confirmed it. I don’t know how to read the grid view of the processor activity but, if it’s a single instant in time, then it’s not a good view of the overall simulation parallelization. The processor curve over time usually looks good on my machine:
I see. The key word in that sentence is “40 points”. That’s just not enough sensors to trigger the need for parallelization. If you run your simulation with 4,000 sensors, then you will see good parallelization. In other words, optimizing a 2-minute simulation into a 1 minute 30-second simulation isn’t really the case that the recipes are built for. We’re more concerned about ensuring an hour-long simulation can run in a few minutes if you have the right machine.
Gotcha. This was also only for testing and optimizing… Ill post a larger project shortly.
However (!) In the iterative process of sketching on the facade of one room, iterating, changing shades etc etc calls for small quick simulations, BEFORE you lock your facade design and conduct full building simulations is a very vital part of the design process.