I have an odd behaviour that will affect the assignments that I run for my 300 first year students of whom roughly 40% use Apple Computers.
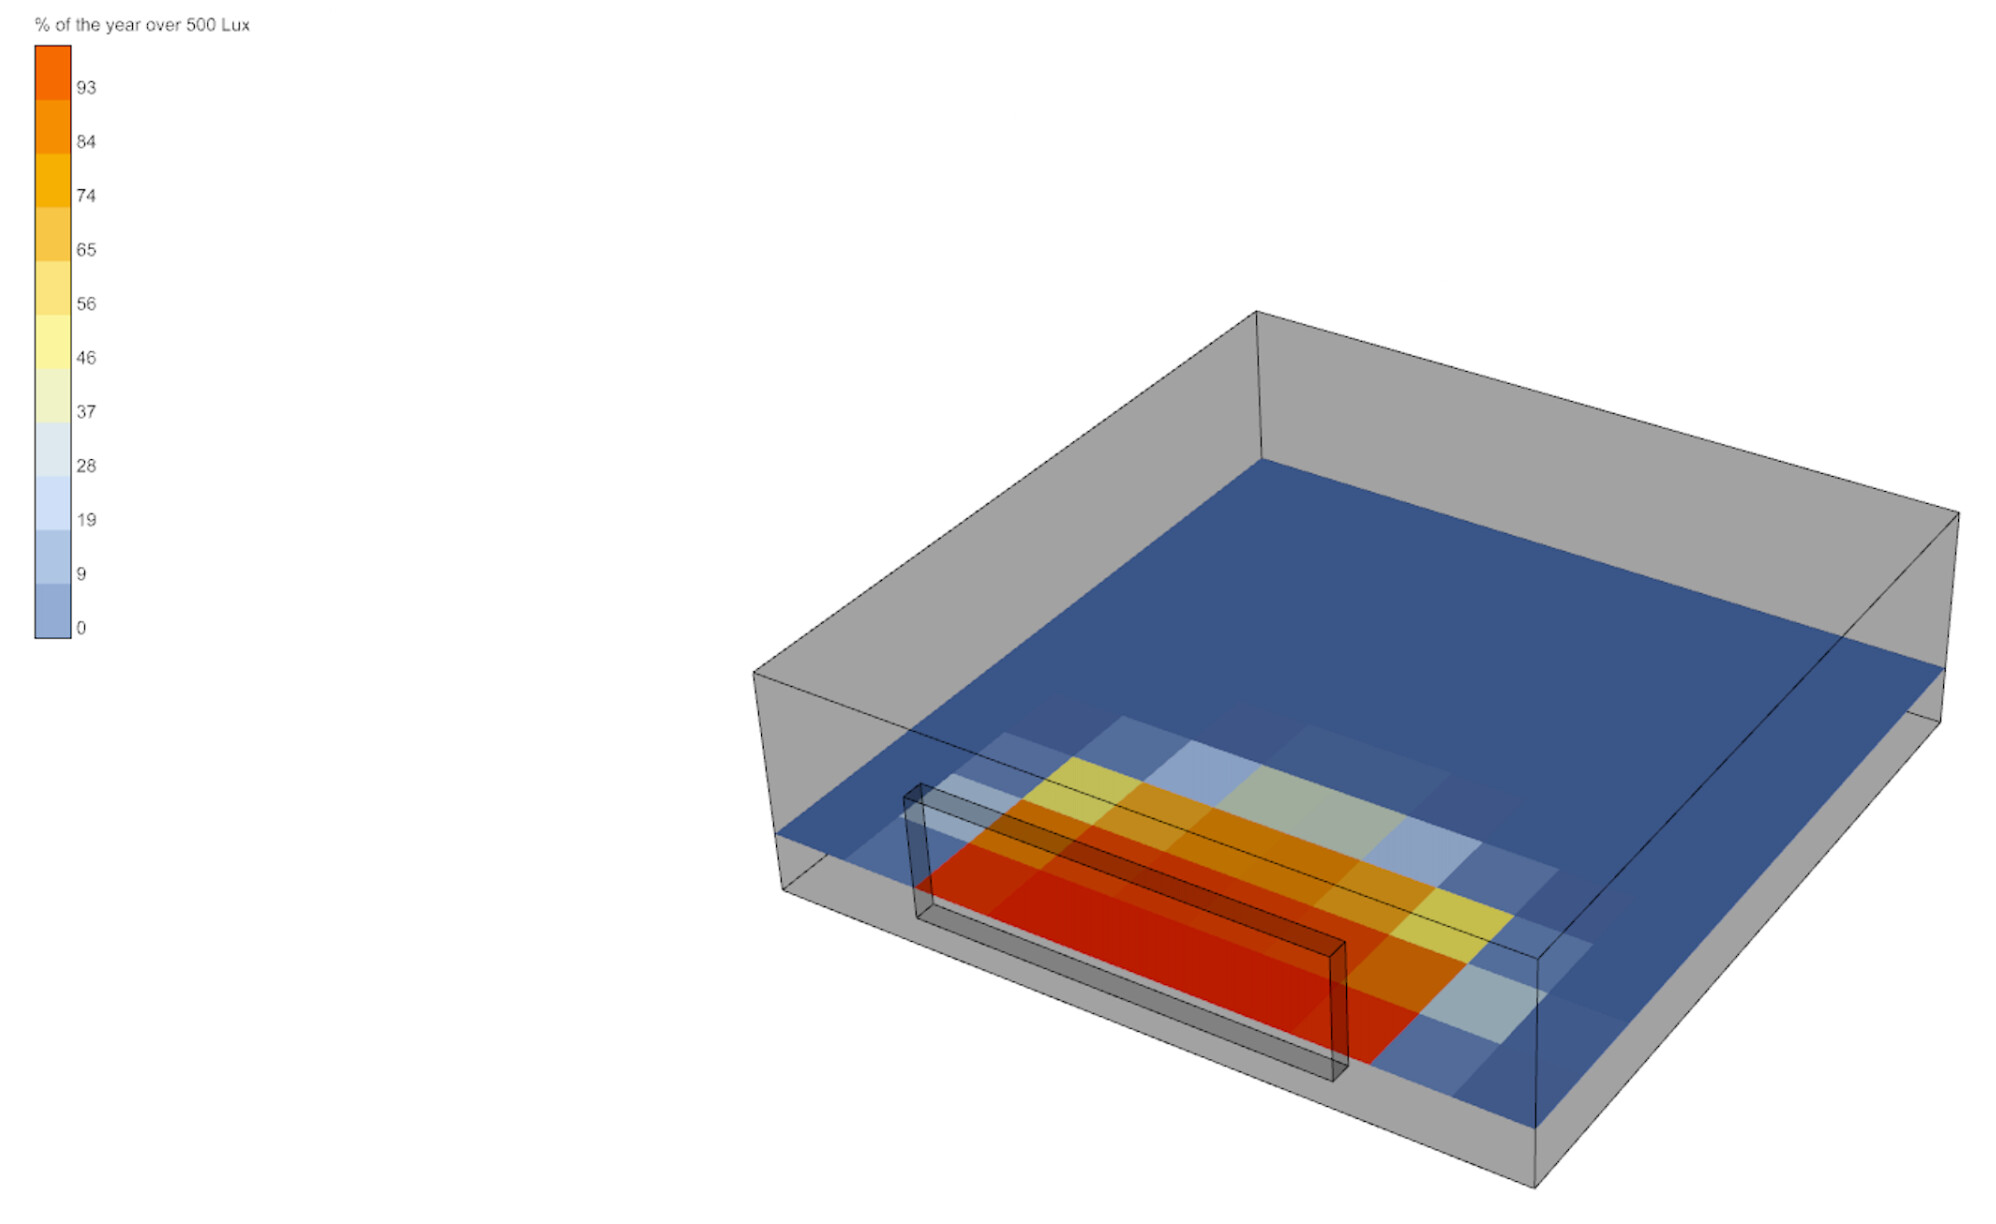
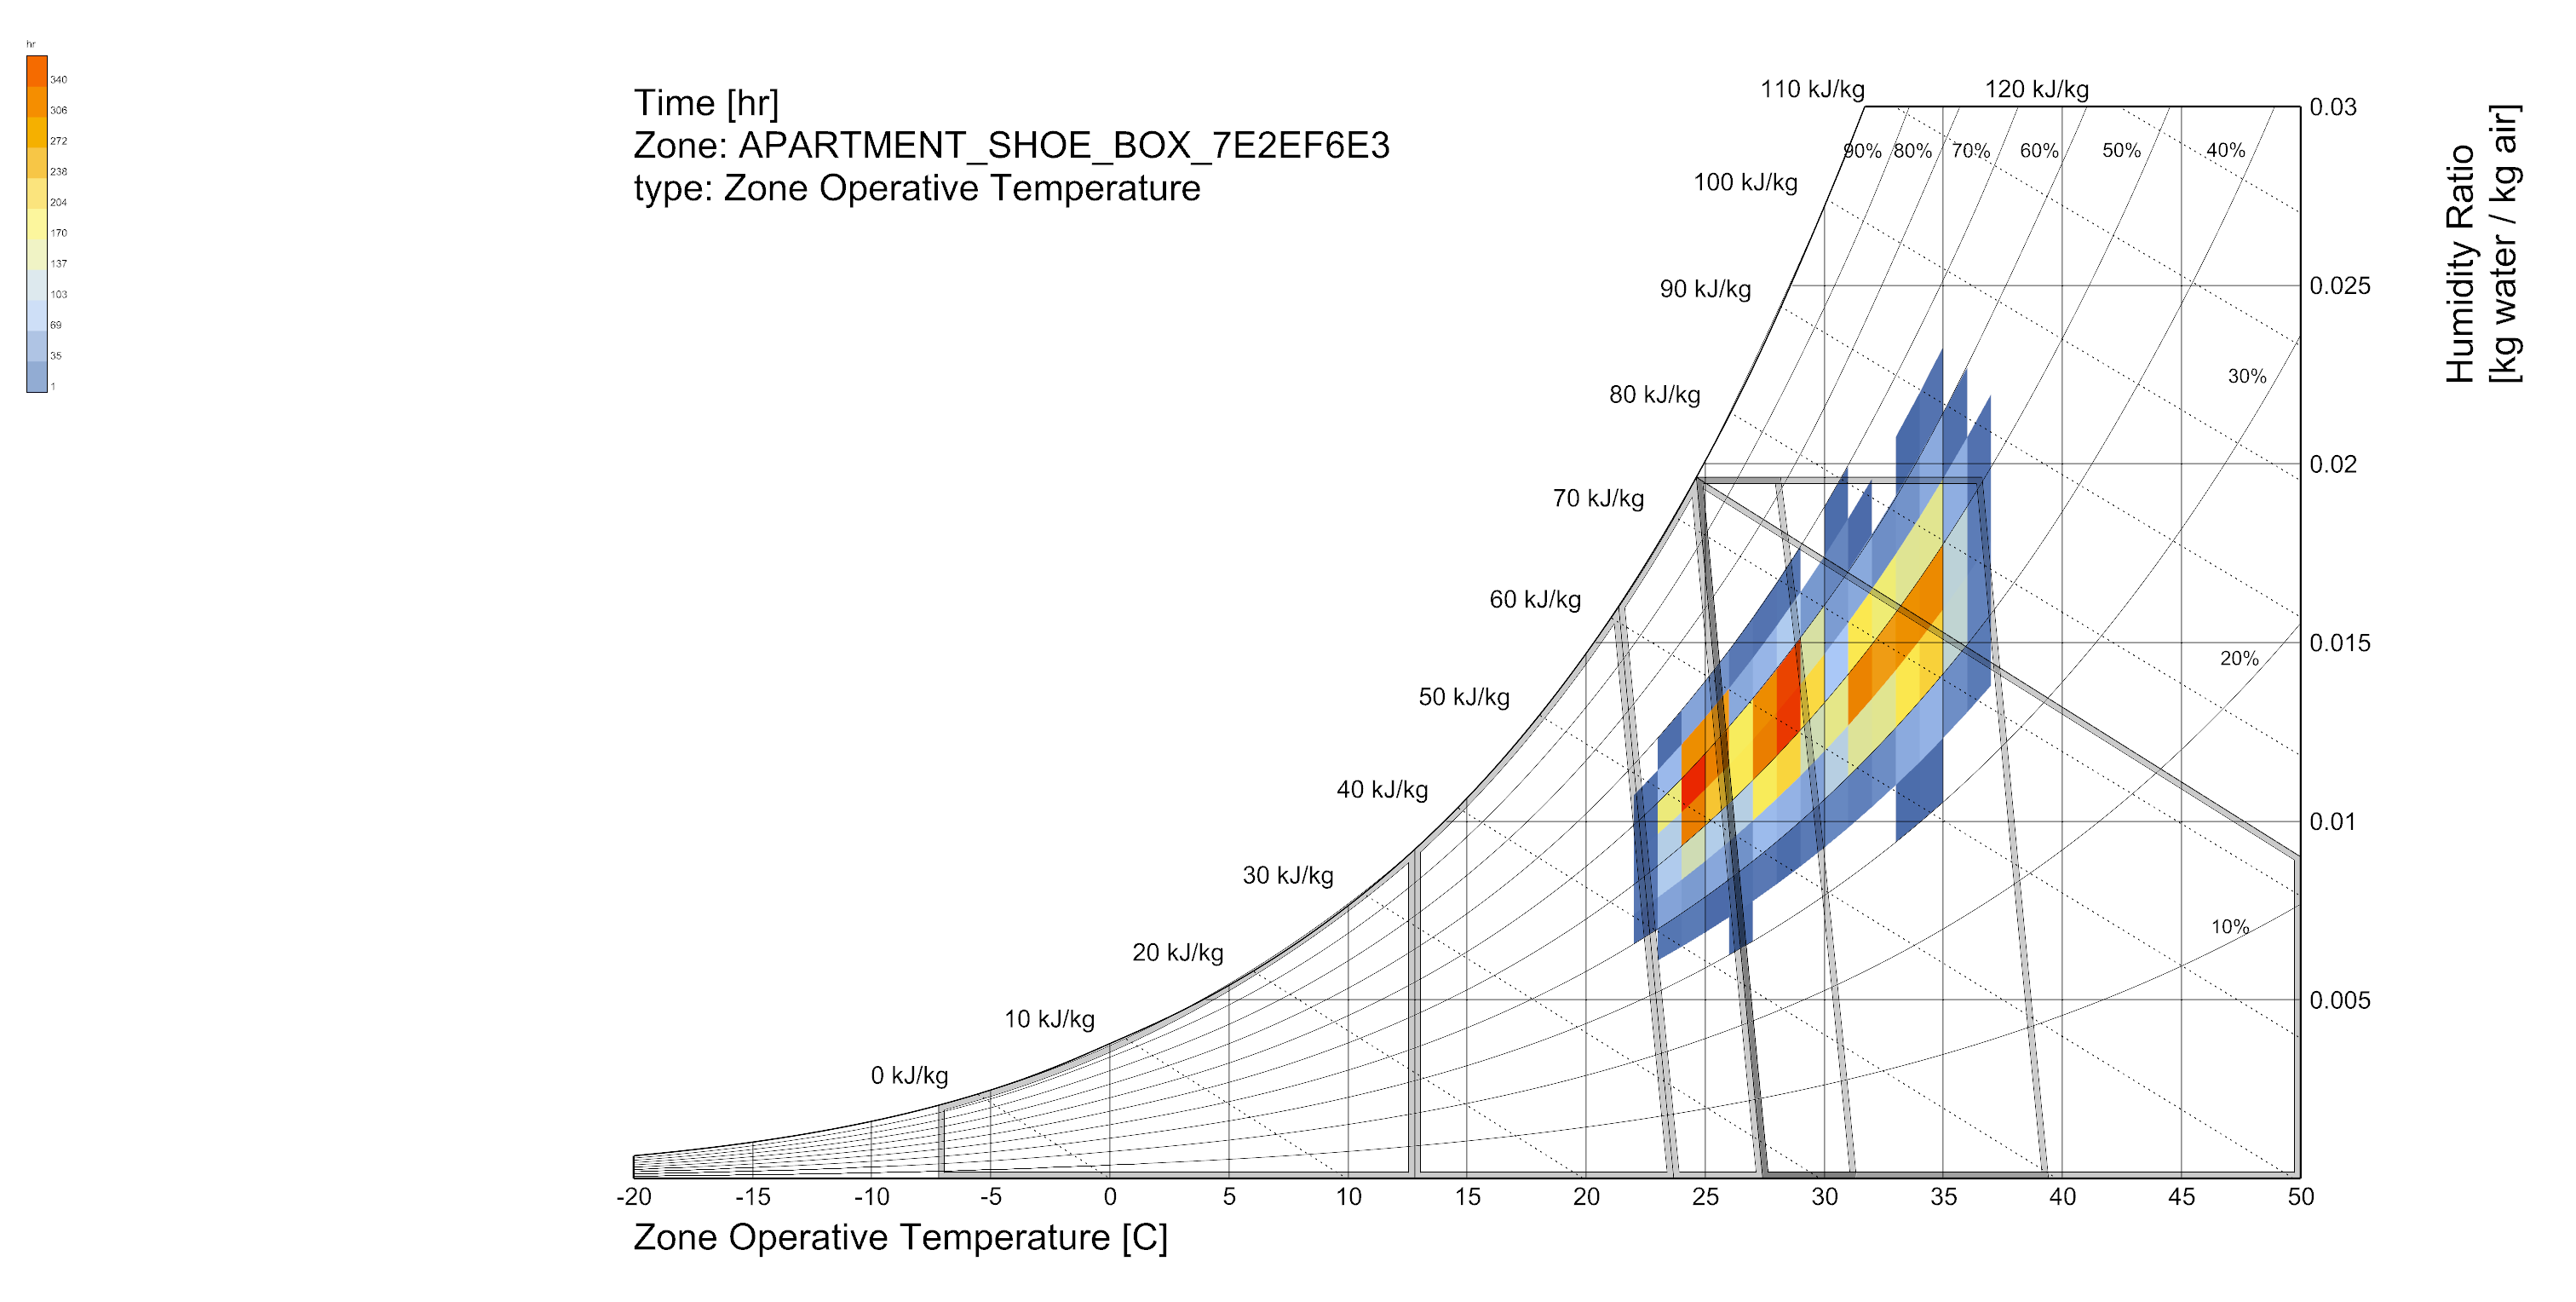
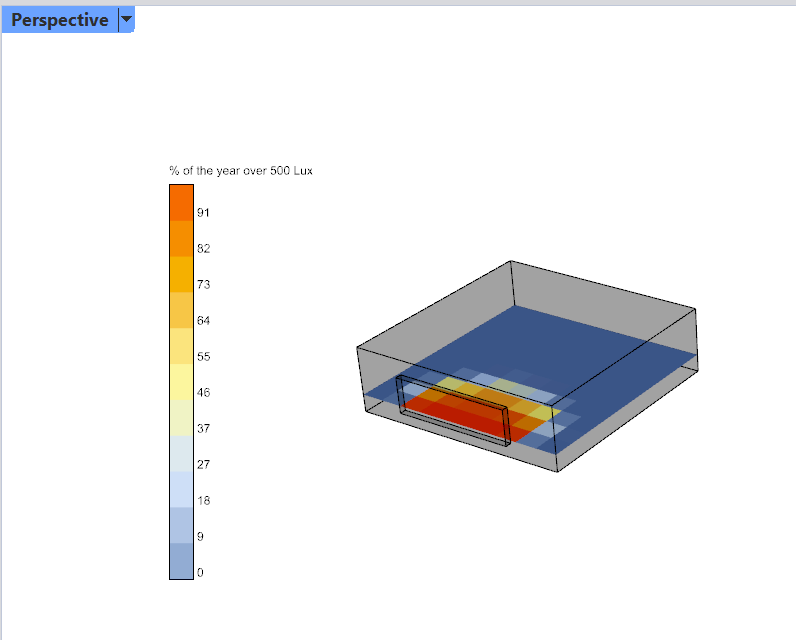
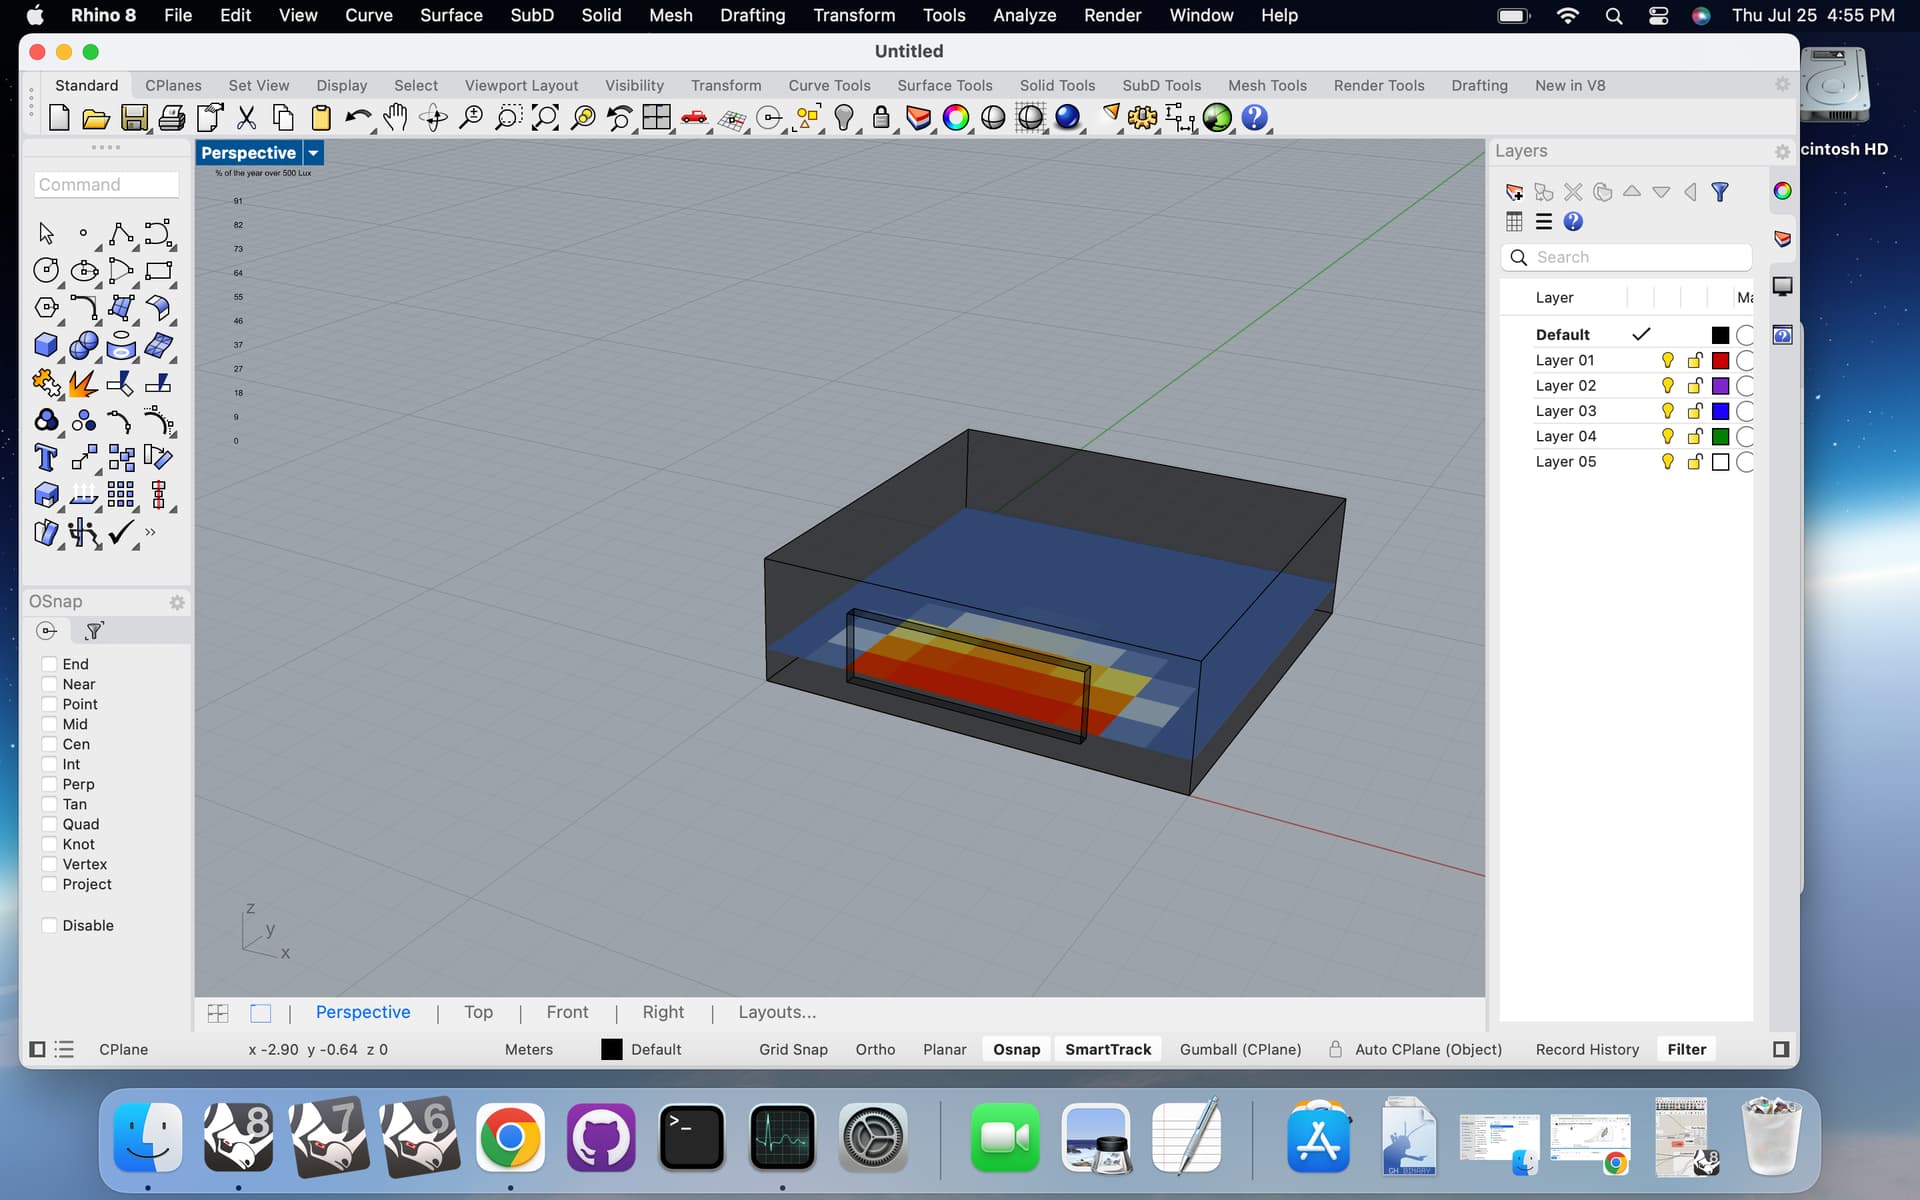
I am using Vis Set +2D Legend parameters to achieve the following appearance of the test files (we have one simple test that OpenStudio is working and one that tests whether Radiance is working. For example: annual daylight shoebox calculation:
Hello @MichaelDonn I have a question for you: how do you get the legend to stay facing the viewport on a corner like you have in the above?
I believe I’ve used human ui or similar to accomplish the task, but if we have a native to LBT way to do so, that would be totally prefered.
best
-trevor
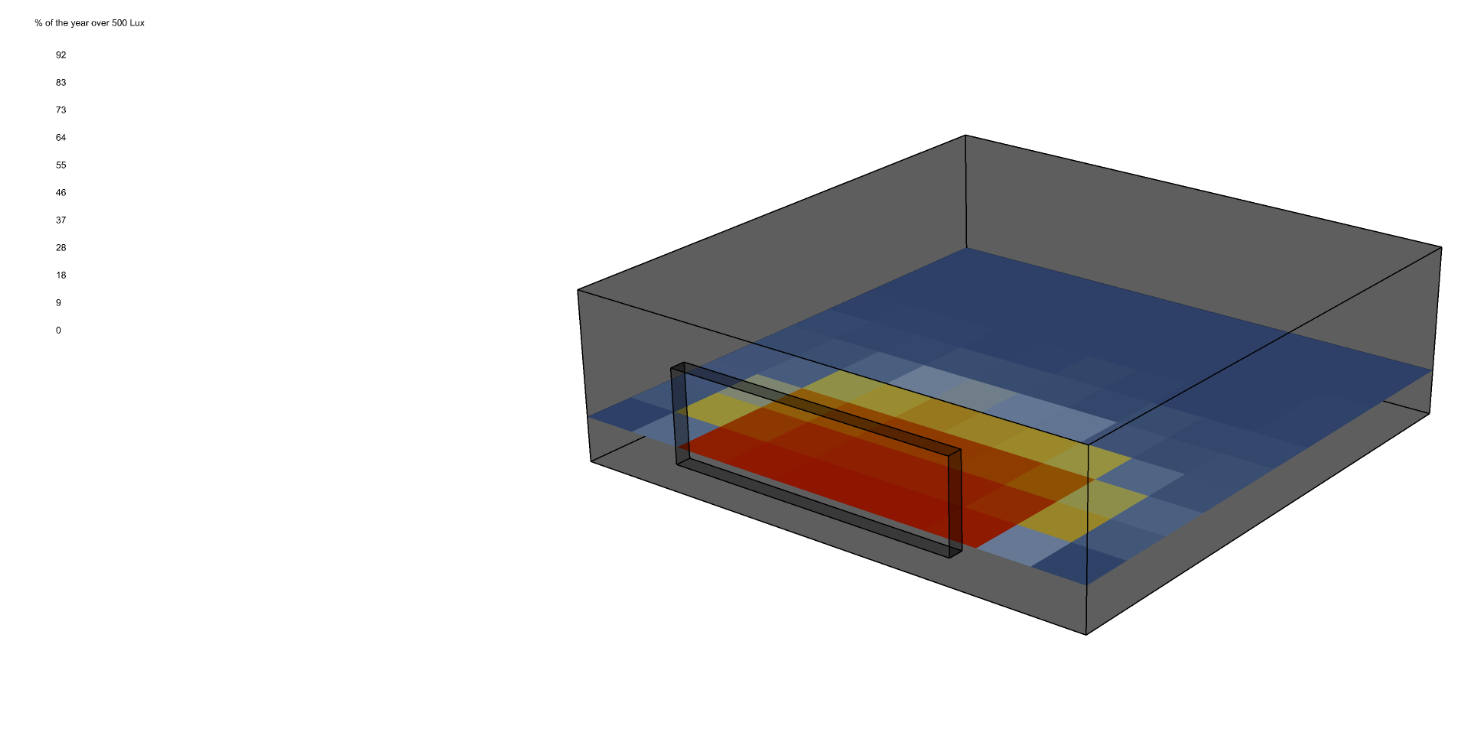
Yes indeed. The visualisation set option allows really cool customised screen oriented graphic display of legends - however, my Apple Computer issue remains. The legend numbers appear on the Apple Screens, buit not the legend colours, the “segments” - changing the size and postion of the legend and its segments moves the text on the page but does not affect the non-display of the colours of the legend.
Hi @MichaelDonn ,
I don’t use mac myself. I’ll ask my students to check this. Hope this may help.
Just checking where the colors are, can you check locating the legend in the middle of the screen to see where they are? Maybe (maybe) this can give some hint what is going on. @chris also may help.
-A.
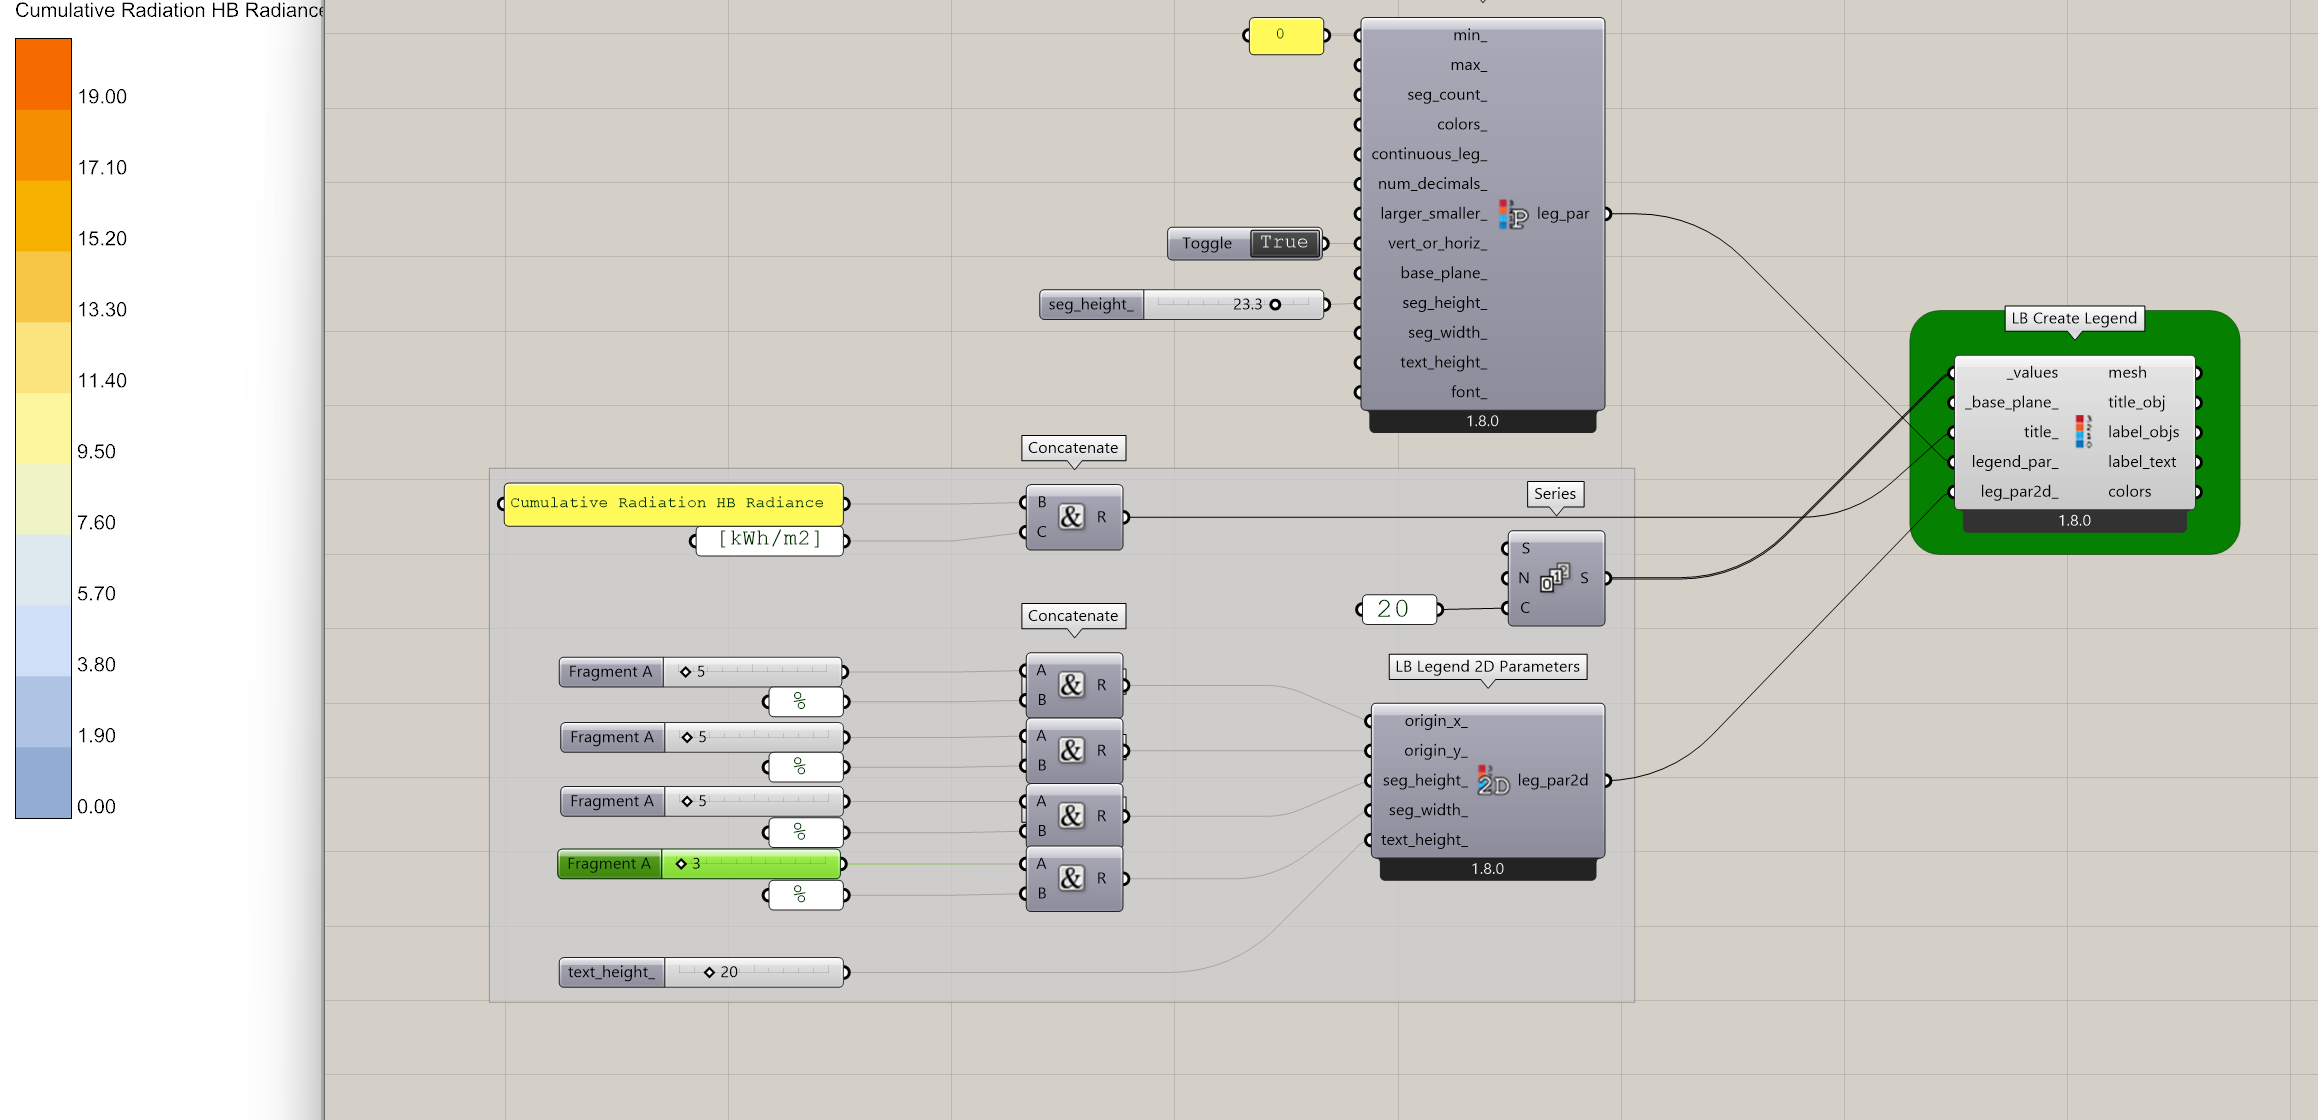
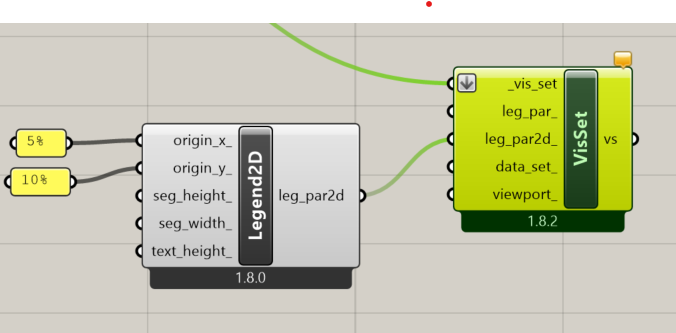
Positioning on the screen is controlled by the legend2D component.
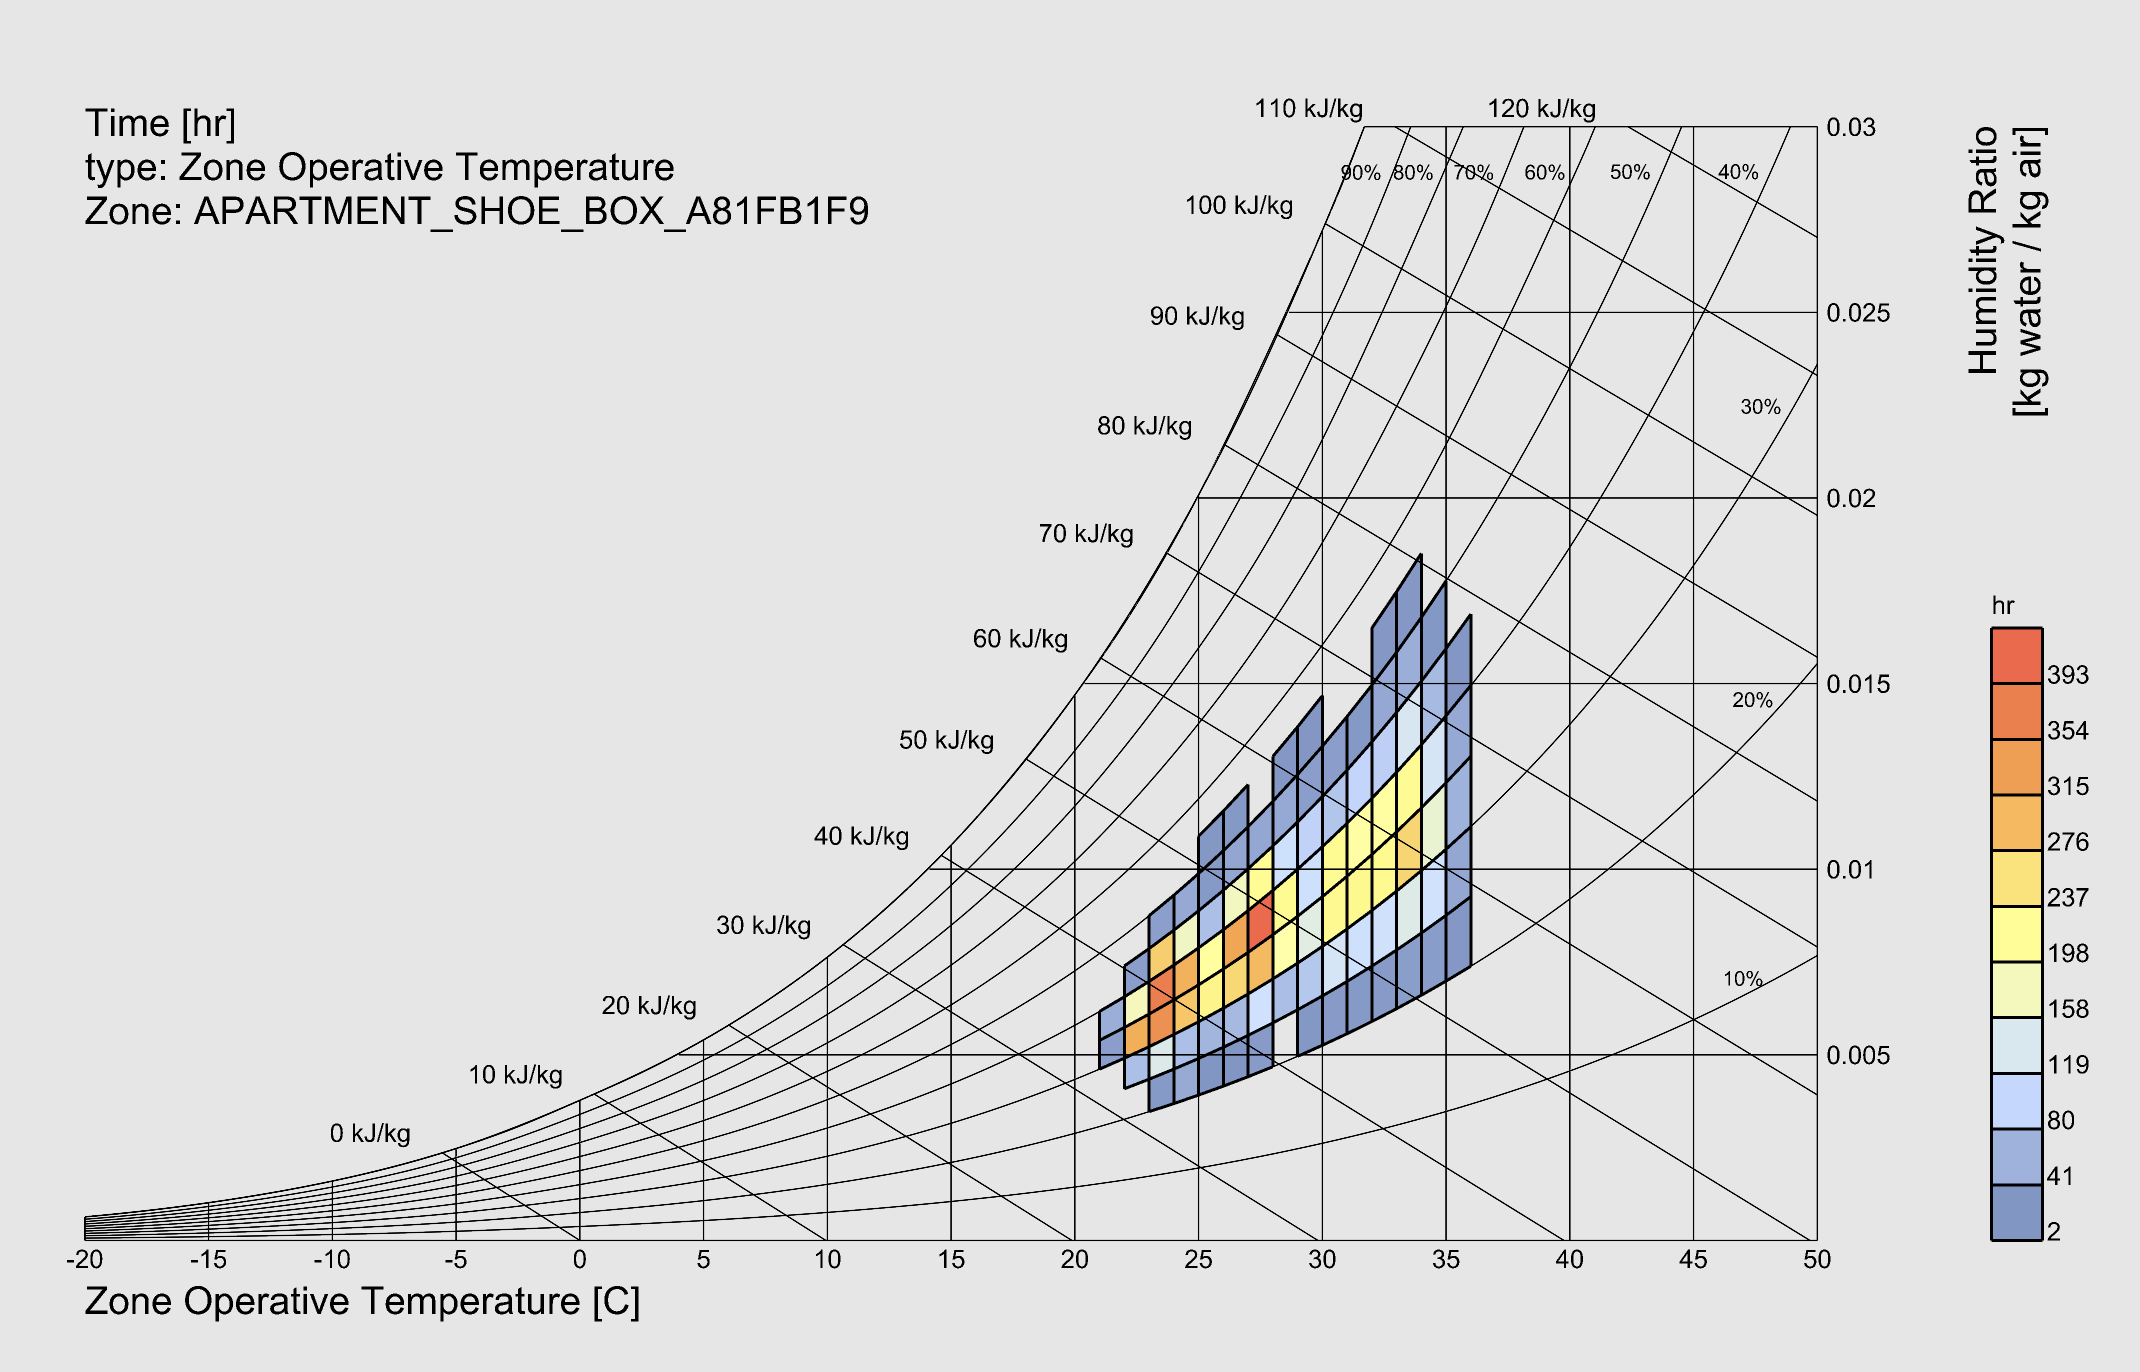
These are the three slightly modified Sample Files that I have sent out to the 300+ students to run on their computers.
I hope next week to get them to run PET analyses of an outdoor park combining wind tunnel test data with solar radiation accumulated over the year and simultaneous air temperature numbers.
Hi @MichaelDonn ,
Unfortunately I don’t have good news. A student checked the issue on her computer.
Using the Mac environment (native) the colors don’t show at all.
Using windows partition it seems to work OK.
Seems like a bug for @chris or @mostapha to add to the development to do list
I will consider over the weekend whether to create an Apple and a Windows version of the learning environment, only one of which has a screen-oriented legend, or just to abandon the screen oriented legend option.
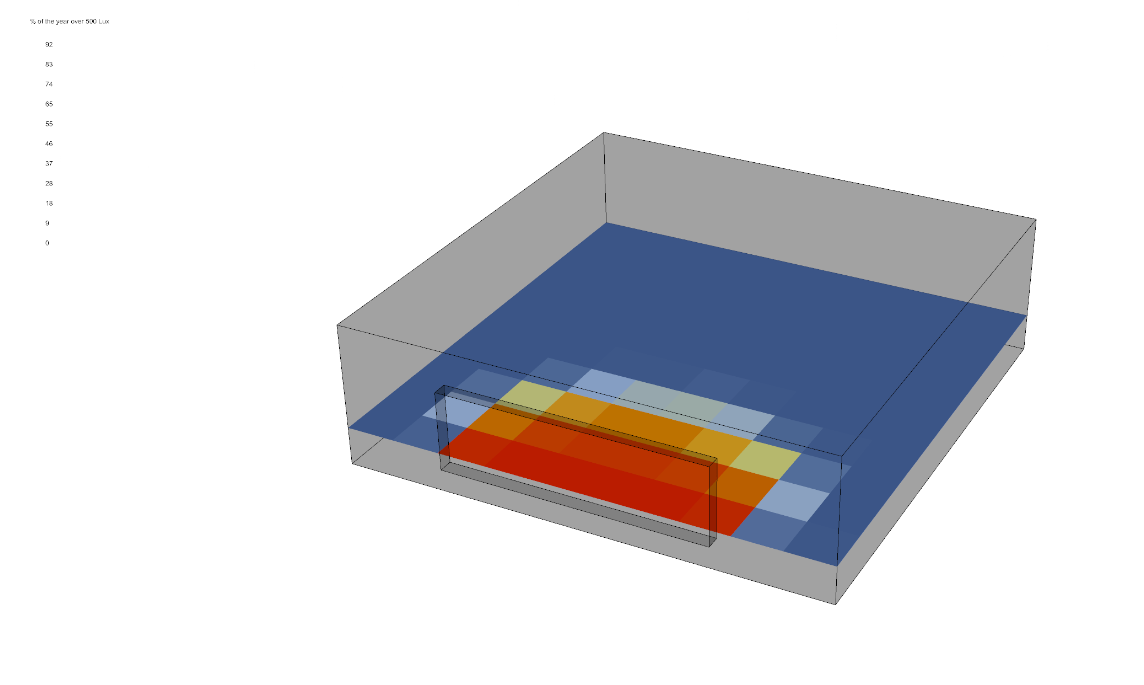
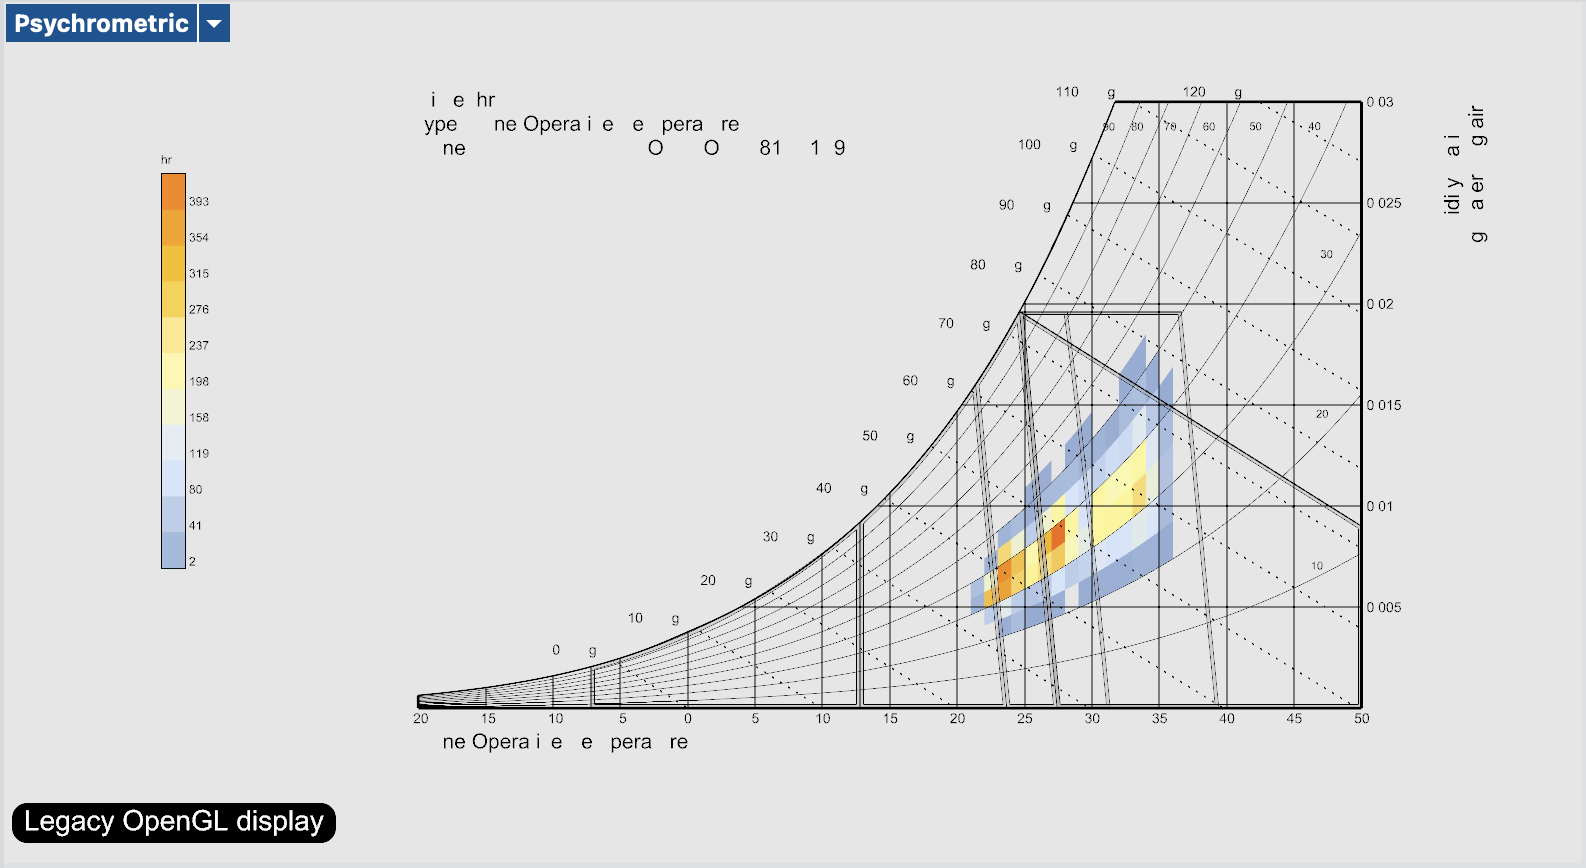
If I use the TestMetal command to set the viewport to the legacy OpenGL mode (this is a deprecated command, it won’t autocomplete anymore), it shows up, but then the other texts get messed up:
I am wondering whether this should be posted on the McNeel forum also, though how to post something there that only users of LBT could test/evaluate is a puzzle…
I would link to this thread on the McNeel Discourse, as I’m not sure where the problem lies exactly.
I don’t know who is on holiday in the McNeel team now, and you are pressed on time, hopefully this can be fixed easily – I get how infuriating these problems can be when it comes to cross-platform teaching (…or working for that matter).
Sorry for the late response here. This definitely seems like it’s an issue for McNeel and so a post on their forum is probably going to be much more helpful than what I can offer. I can say that I was able to create the issue on my old 2017 MacBook running Mac OS 13.6.7:
I can also say that the specific part of RhinoCommon that is failing to render the legend correctly in this case is the DisplayPipeline.DrawSprite method. You can see that it is called here inside the component source code to render the legend to the screen:
I sense that McNeel should be able to fix it but, knowing that your deadline is likely to happen before McNeel can push a new Service Release, it might be wise to develop an alternative .gh definition for your class.
Thanks. I have this morning posted the issue to McNeel where there are multiple past references to Metal display issues but not this one.
And, yes, the classwork strategy i am toying with is at present 2 options:
a Mac and a Windows version of the scripts - which i can see some students worrying about
no visualisation set stuff (for equity, this is probably my goto)
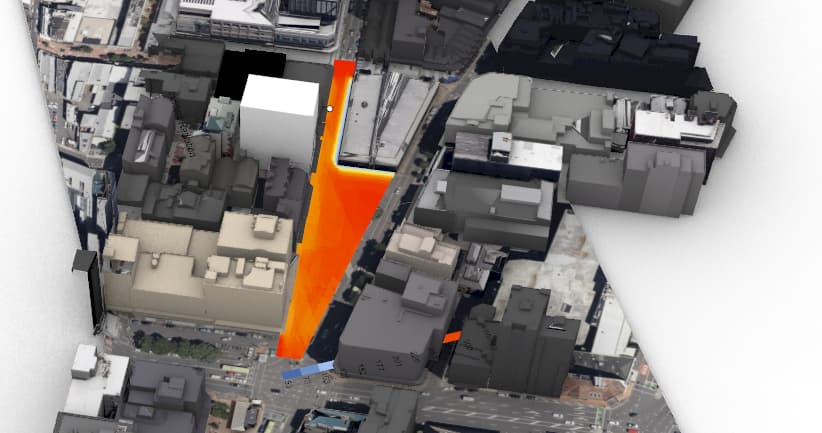
BTW: i am now so sold on this vis set stuff i keep looking for it in room heat map outputs, so perspective view of PET distribution across a park (combining wind tunnel test data, solar radiation data and temperatures from the epw file) can have a flush to screen legend… (another item for your wish list?)
The recommended way of setting up visualization sets for any of the studies that produce spatial heat maps is to use the LB Spatial Heatmap component to process the study results and the mesh together. You’ll see that the “Spatial Heatmap” component has an output for vis_set, which you can plug into the LB Preview Visualization Set component to further get things like a screen-oriented legend.
So I know it’s an extra component in the workflow but this will give you the most control over the visualization and it’s why I have not been planning to add vis_set outputs to all of the various components that run spatial studies.
But I can see how I would use the LB Spatial Heatmap component to process that incident radiation using the Results and Mesh outputs as input to the Spatial Heatmap…