Now updated with ERA5 global reanalysis climate data from Copernicus/ECMWF. Global coverage and data from 1980 until recent time. Fast access to long time series, formatted as CSV files or EnergyPlus EPW files.
CAMS satellite derived solar radiation data available as well, covering Europe, Africa and Middle East (roughly -66° to 66° in both latitudes and longitudes).
The NOAA data all comes directly from on-ground measurements made at specific locations on the planet. The reanalysis data is often derived from on-ground data but my understanding is that it uses some fancy atmospheric models to help fill in gaps between locations and across time and it may also use satellite data to improve accuracy (Lukas can explain better than I can).
Granted, I should also say that the NOAA data sets tend to have a lot of missing hours and that’s why you see all of the interpolation components in this example. So, in a sense, we are doing a little bit of data “re analyzing” to make EPWs from the NOAA data by linearly interpolating over missing hours. But real reanalysis like what Lukas posted is a lot more sophisticated and that’s why you see it works over much greater distances and lengths of time than you’ll be able to get with just the NOAA data and linear interpolation.
Other than the gaps in the airport data, the biggest benefit of using reanalysis dataset might actually be for radiation purpose so that the shortwave/longwave radiation values are derived from atmospheric physics model rather than empirical methods like the Perez model using cloud coverage. Airports cloud covers are actually reported by people, in increments of 8th (1/8, 2/8, 3/8 etc.) and originally intended to help aircraft.
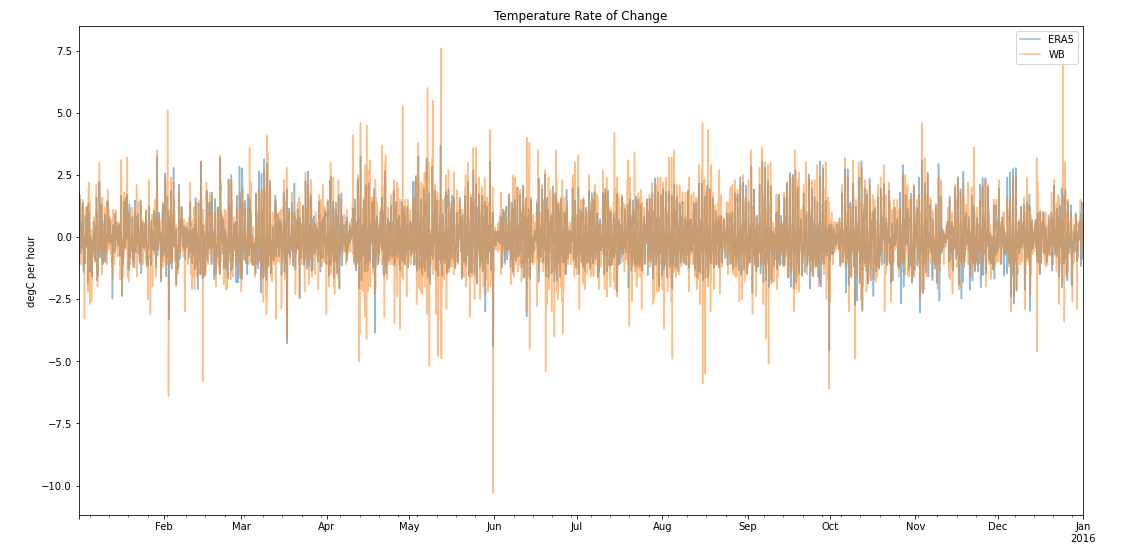
For parameters like temperature also, airport data tends to be more noisy, as you can see in this comparison of EPW data from Whitebox Technologies for Boston in 2016. You see values of hourly rate of temperature change ranging from ~-10C to ~+8C for ISD data vs. about +/-4C for ERA5, which seems more likely unless it’s an extreme weather event.
FYI, NASA also has POWER LARC service providing reanalysis dataset based on MERRA-2 reanalysis data for building energy simulation uses. Dru and Linda from One Climate Building did some comparison of ISD, MERRA-2 vs. ERA5 dataset for about 30 cities around the world for 2004 to 2018 and the alignment apparently looked very good (on an initial assessment).
I agree with Joseph, the main benefits are the consistency (no gaps, less errors) and access to variables that seldom metered locally (e.g. radiation). ERA5 is also a fully open dataset (e.g. European companies are not allowed to use European stations data from NOOA databases for commercial purposes). One another benefit is that you can have the same NWP-engine for both historical weather (reanalysis) as for your future weather (forecasts and climate projections).
Some disadvantages: Even though ERA5 is the currently best available global reanalysis, it is still fairly coarse at is roughly 30 km horizontal resolution. It can miss out on local features like topography (especially in mountainous regions), coastlines and urban heat island effects. Local observation data or regionals reanalysis are likely better source in those cases. However, I hope to address these issues with adding post-processing features or/and more high-resolution regional data sources.
I’ve seen that you can achieve some impressive result with the Ladybug tools. But I’m not very familiar with Ladybug tools myself, so I would love to hear more of the use cases and what sort of weather data that is needed. Are there uses cases for long multi-year time series? Is it mainly TMY files that are of interest? How about AMY, future climate projections and extreme periods? Are there use cases for higher temporal resolution (the satellite based solar data is available in 15 minutes resolution)?
We have an updated connection to the Urban Weather Generator (UWG) in the works right now, which morphs rural EPWs to account for urban heat island and that @josephyang improved for this thesis. So that can help address some of the limitations.
To clarify, selling the data itself or data products like EPWs isn’t permissible. But, if you are selling a service like energy modeling that happens to use EPW data derived from NOAA data, this should be ok. This is for the same reason that the Ladybug Tools AGPL license doesn’t apply to the images and PDFs that people make with Ladybug Tools but it can apply to Grasshopper scripts using Ladybug Tools. Or why Google doesn’t own the paper you wrote because you typed it in google docs, though they can exercise some IP over things like google doc extensions. There are limits to copyright when it is used to make new types of content.
All of Ladybug Tools is set up to run simulations and manage weather data in chunks of up to a year. Avoiding the multi-year case makes it much easier to perform certain operations on the data and, if people need to run multi-year studies, they can always run multiple simulations. But, other than that limitation, everything else can be used. AMY and extreme years are particularly helpful and finer timesteps than an hour can be used in several types of analyses.
Energy index (like degree days, but including effects from solar and wind)
Visualizations
The energy index / degree days can be used for regular weather normalization. But are also an effective way for finding interesting weather periods, like typical years or extreme/mild periods.
I am currently analyzing the Urban Heat Island (UHI) effect on an urban area and generating morphed EPW weather files for energy simulations using UWG in Dragonfly. I’ve been working with TMY datasets, but I was wondering if there is a way to generate more accurate and reliable weather data for this purpose. Specifically, is there an alternative to using TMY datasets that would be more representative, such as using AMY data or other methods to better capture the UHI effect for energy analysis?