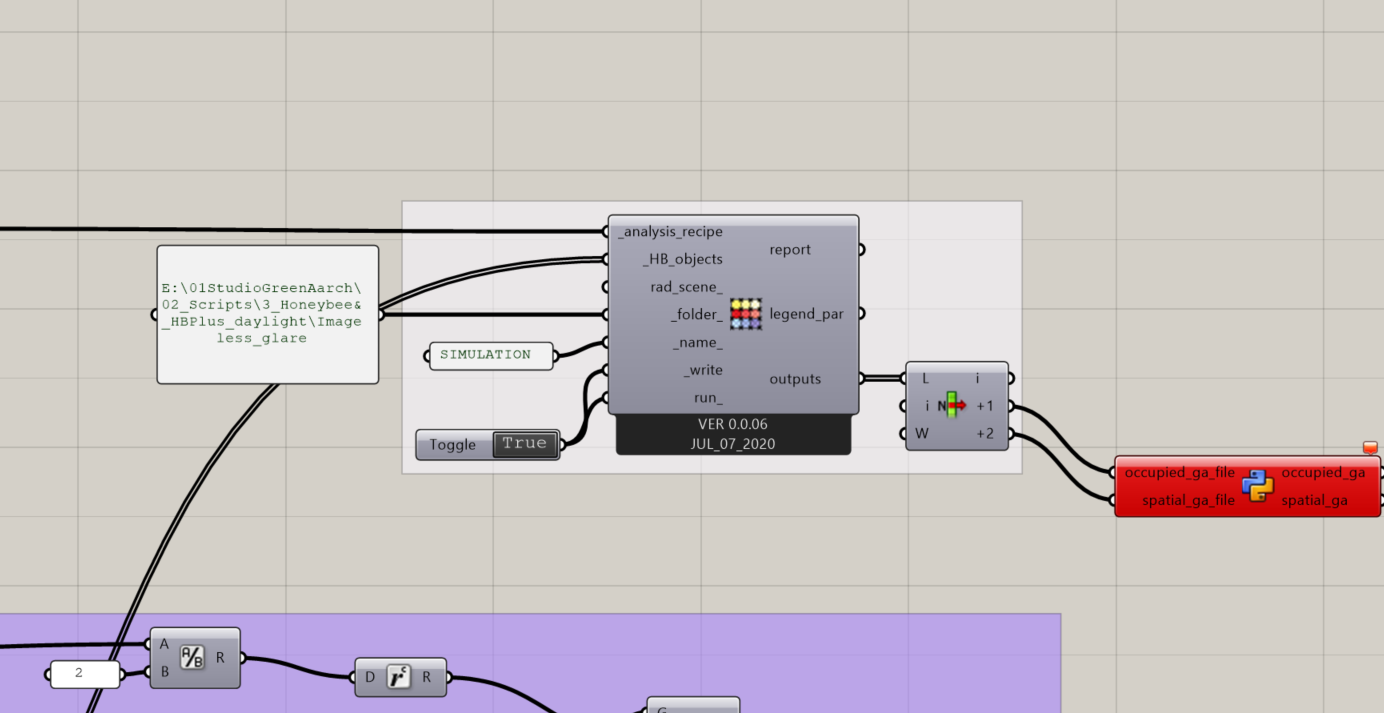
A custom Python component that reads the results line by line while skipping the Radiance header.
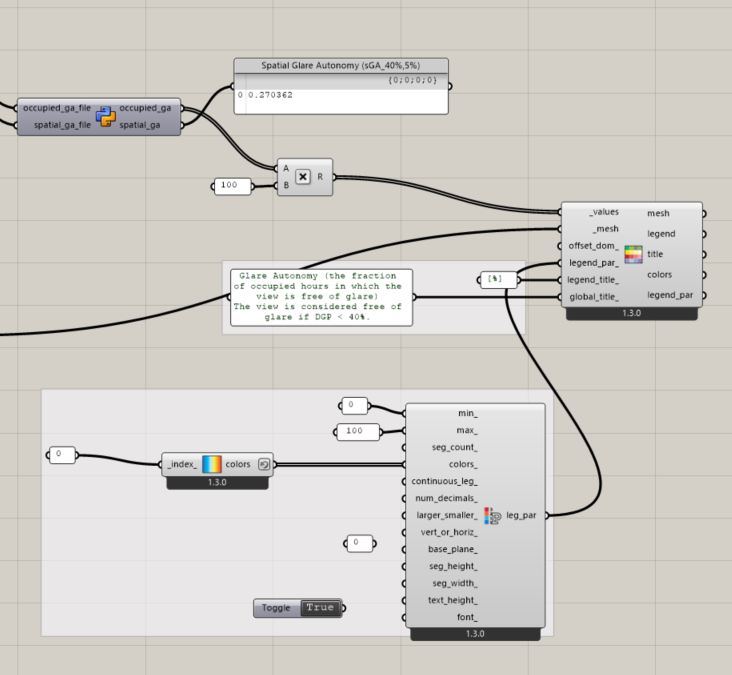
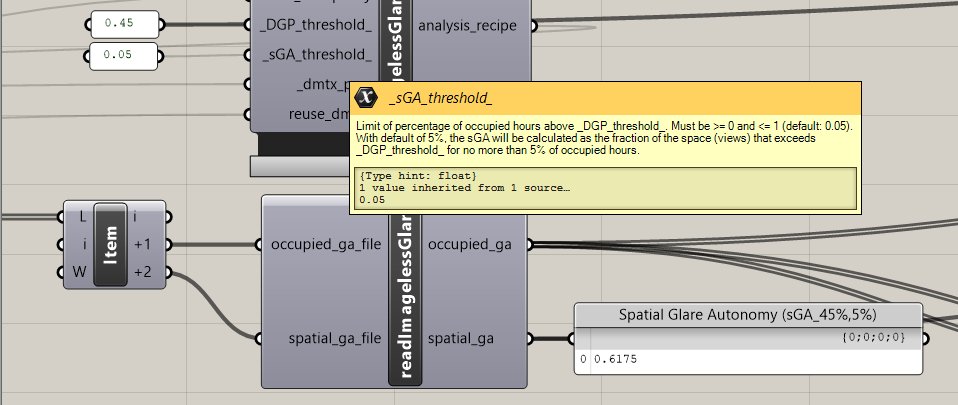
It is correct that taking the average will give you sGA_40%. If you want that, you can average the output of occupied_ga just fine. But in the tutorial sGA_40%,5% is calculated. It basically says that we only count the view directions where no more than 5% of occupied hours exceeds the DGP threshold.
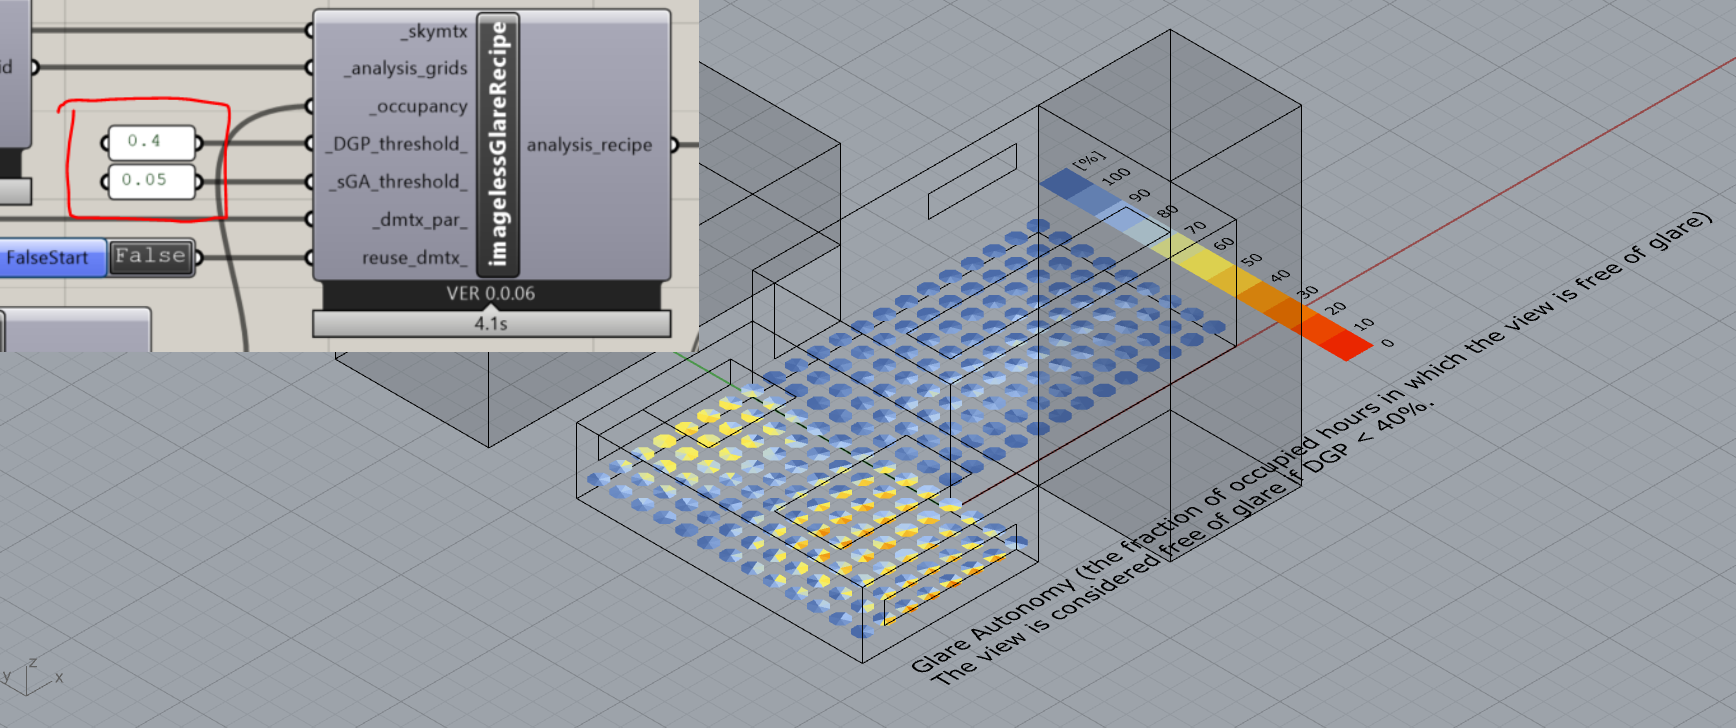
Since there is a growing interest in the method, I added the DGP and sGA thresholds as parameter inputs, and tidied up the Python file… at least somewhat.
I found a small bug @mikkel. When a folder location is provided to "run radiance component it fails to run without even starting the radiance batch window. Once the file path is removed it runs fine. I have no white spaces on the file path. Here is the .gh file for refence imagelessGlare_Test.gh (536.6 KB)
One more thing to report. Once file path was removed and after finishing the simulation, the legend preview below is not legible. The earlier Version of your script was working fine for both cases. For your reference I am using Rhino 7.
I think it might be because you have a “&” sign in the folder path. At least I was not able to run the batch file with a “&” sign in the path. Can you try a different path?
Unfortunately I don’t know what’s going on in the other issue related to the legend.
@mikkel You are correct, It has the “&” sign that was creating problem. I didn’t knew “&” is also an exception for radiance. Thank you for pointing out.
For second issue I could solve it by replacing latest LBT heat map from its legacy counterpart.
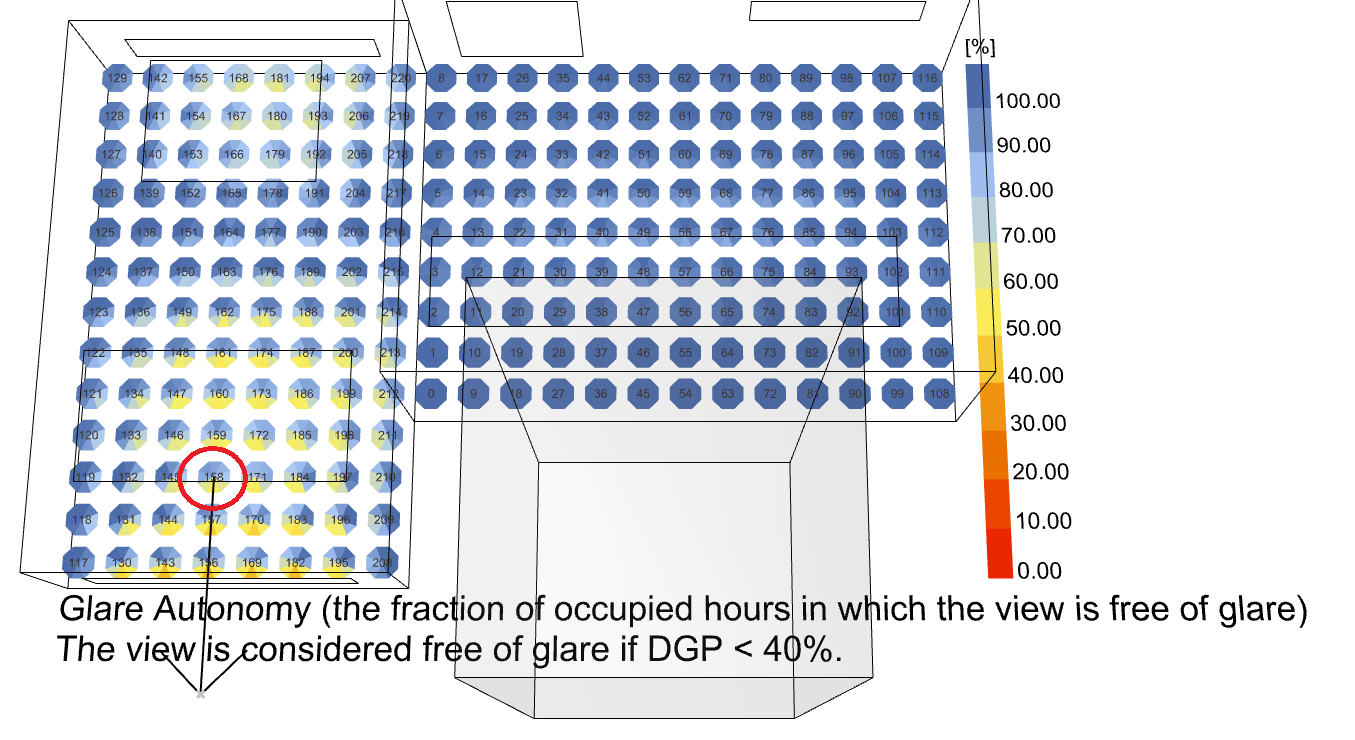
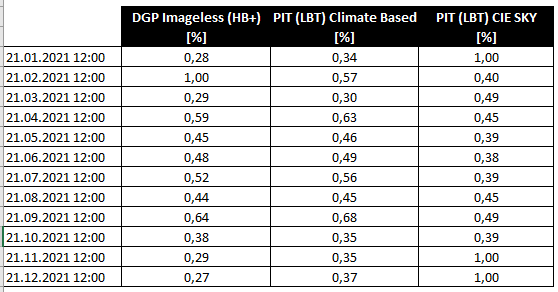
After the imageless analysis I have extrapolated from the views…scene…default.dgp, only the results of the analysis of the sensor 158 which looks in the view direction. (This can be found in the attached file “views…scene…default-AllSensors.dgp”).
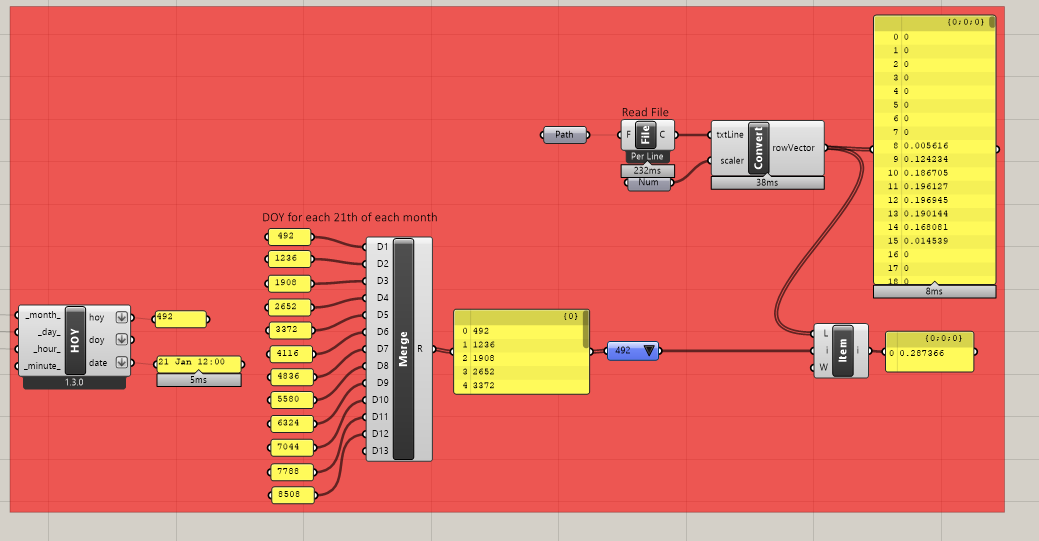
Than I read the analysis result and extrapolate, at 12 noon every 21st day of every month the DGP result.
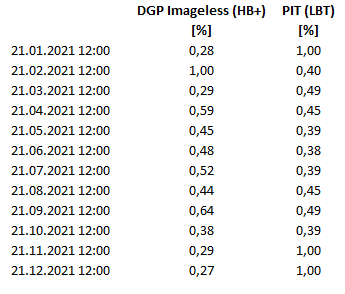
after this, for exactly the same days and times, I rendered the view for the Sensor 158, through the new LBT1.3.0 _PIT-View and made the comparison of the values.
In the folder you will find the comparison table and the various rendered images.
In the Grasshopper file, everything inside the red groups has been added or modified by me.
If I have not done anything wrong, as you will notice there are some inconsistencies.
One thing I noticed is that you used the “HB CIE Standard Sky” for the PIT renderings, while the imageless results are based on the epw. The differences between the two glare methods can probably partly be explained by the use of a different sky for the renderings. Using “HB Climatebased Sky” will give you a better basis of comparison with the imageless results.
EDIT: Btw, if you only need to analyse one view direction for the imageless method, you can create an analysis grid with only one point and one direction.
Dear @mikkel,
If I can afford, I would have a request to implement the script and a question about one component.
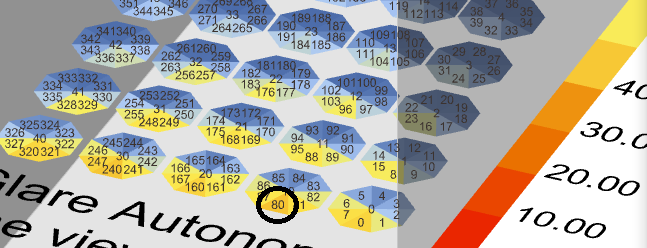
Having already the possibility of being able to analyze so many sensors and directions at the same time, in my opinion would be optimal, to be able to extrapolate the values for example of a single direction (per example the point 80) directly in the _readImagelssGlare component.
At the moment to do it, I need to read and extrapolate from the file “views…scene…default”, the string with the values of the desired sensor, save and convert it so that it is readable in GH.
I can understand that it can be complicated, but in my opinion it would be a great addition.
I can’t understand the decimal handling of the value.
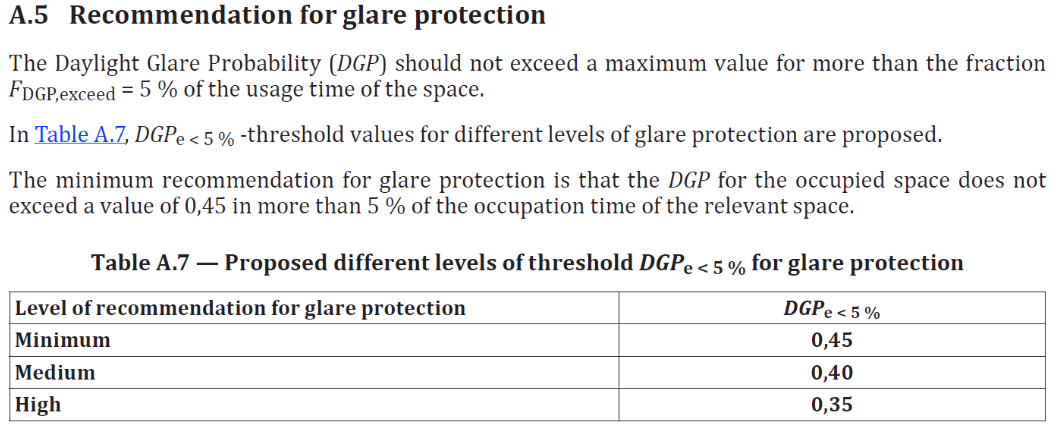
If the Treshold is 5% (right according to the EN 17037), why your input is 0.05?
Shouldn’t the final result be 6% and not 0.6?, ie that 6% of the occupied hours has a DGP greater than 0.45, and in this case is 1% over the treshold?
I agree that this option would be great to have, but it is unlikely that I will add for now. There is an open issue for this recipe, and when the time comes for implementation, we can look through this forum post (which is linked to in the issue).
I have used this Radiance pipeline to calculate sGA. The 0.05 is just the decimal value of 5%.
hello, i want to know this imageless DGP calculate system how to replace the origin system that included illuminance simulation. And has this been published in a journal?
Could you help me with the interpretation of the results?
Value - SGA_40%.5%
Corresponds to the percentage of sensors / orientations that meet the criterion, from SGA_40%.5% [Espaço, area ]
or the percentage of the hours (eg 90% of the time) is the criterion met in the sensors regardless of the orientation? [Tempo]
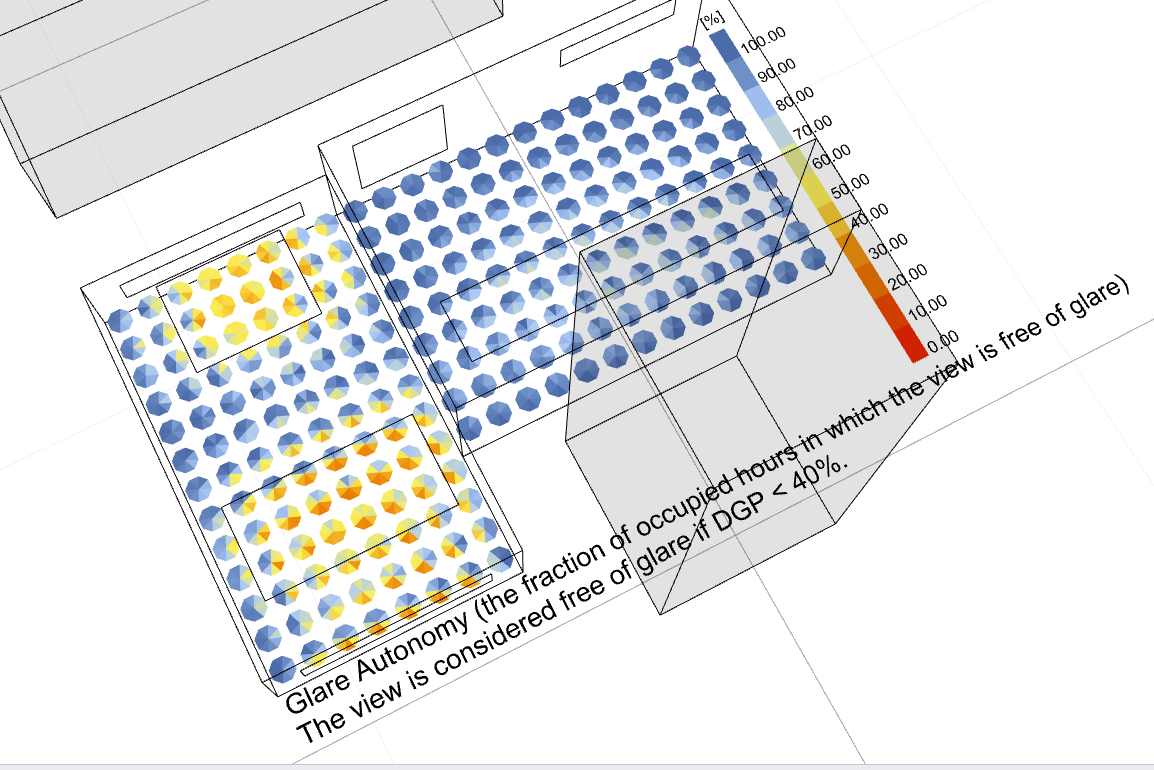
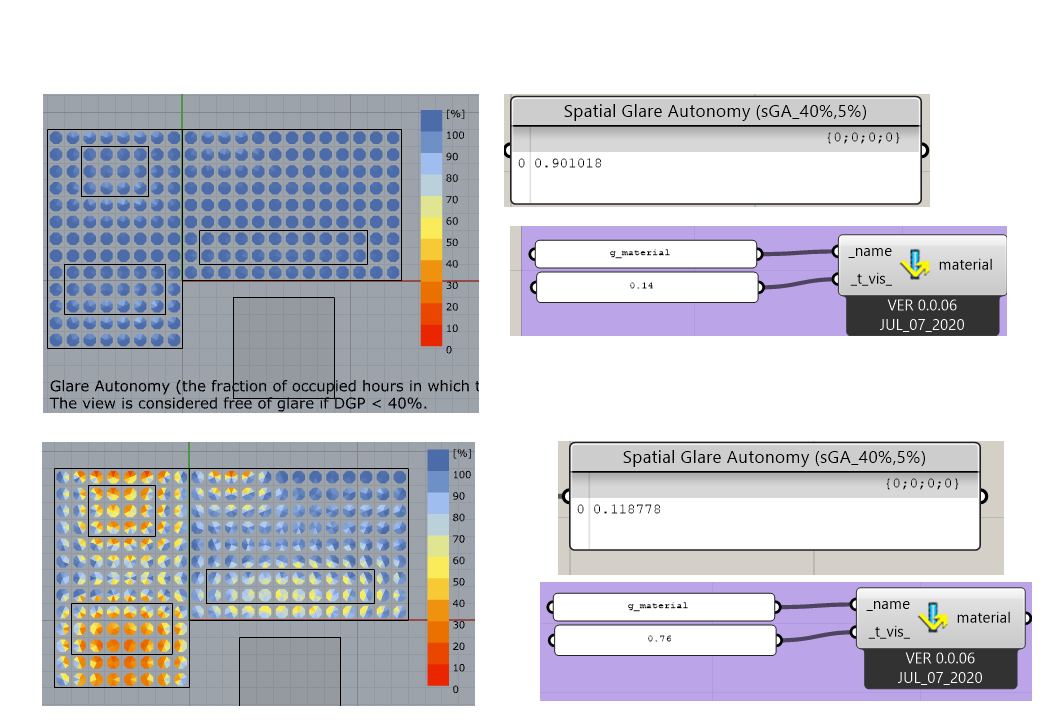
visualization chart
Could you clarify what is being measured in the graph in percentage SGA or DGP?
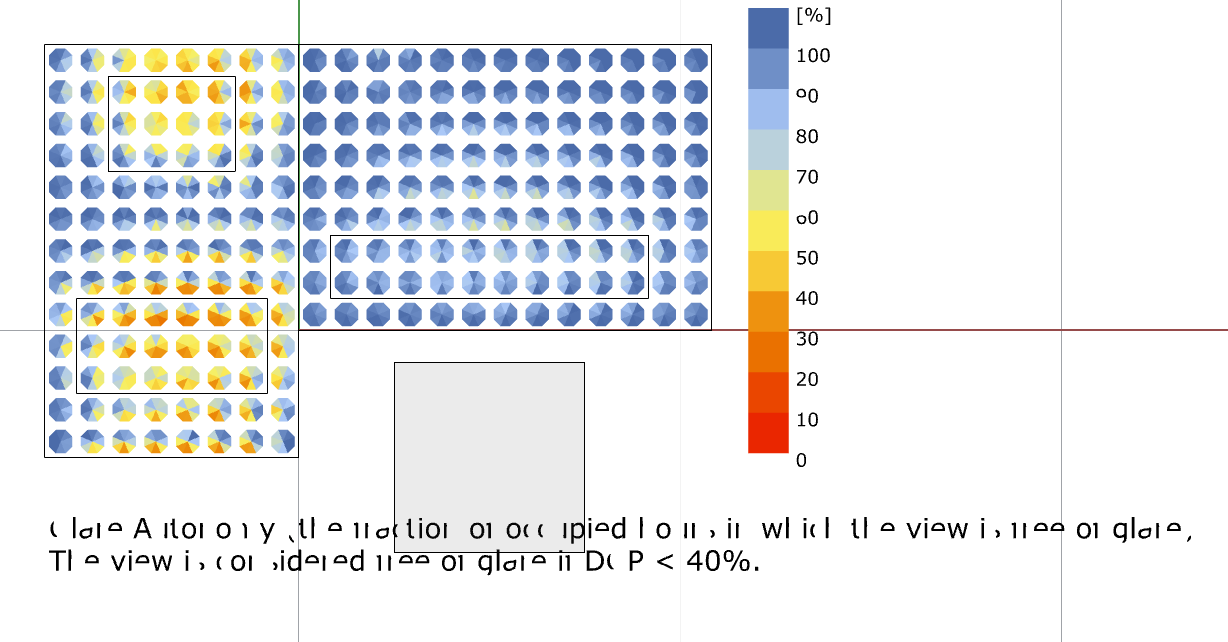
good results are blue and bad results are red?
blue means there is not glare 100 percent of the time and red means there is glare 90 to 100 percent of the time?
would there be a way to place the results numerically in the meshes
It is the percentage of sensors that meets the criterion.
It is the fraction of hours where there is no glare, in this case glare occurs at DGP = 40%. Yes, blue means less glare. If the glare autonomy is 100% for a given sensor, then there is no hours where the DGP is 40% or more, i.e., it is free of glare 100% of the hours.
There’s no official LBT version of this recipe yet but we have to implement it for our work at some point in the next couple of months. You’ll know when it’s been added to the development version of the plugin when you see this issue closed: