I have an EnergyPlus thermal bridge modelling conundrum.
The convention for calculating an R-value for construction that has framing timber within it is well described elsewhere in this forum: Create thermal bridge for Honeybee energy analysis
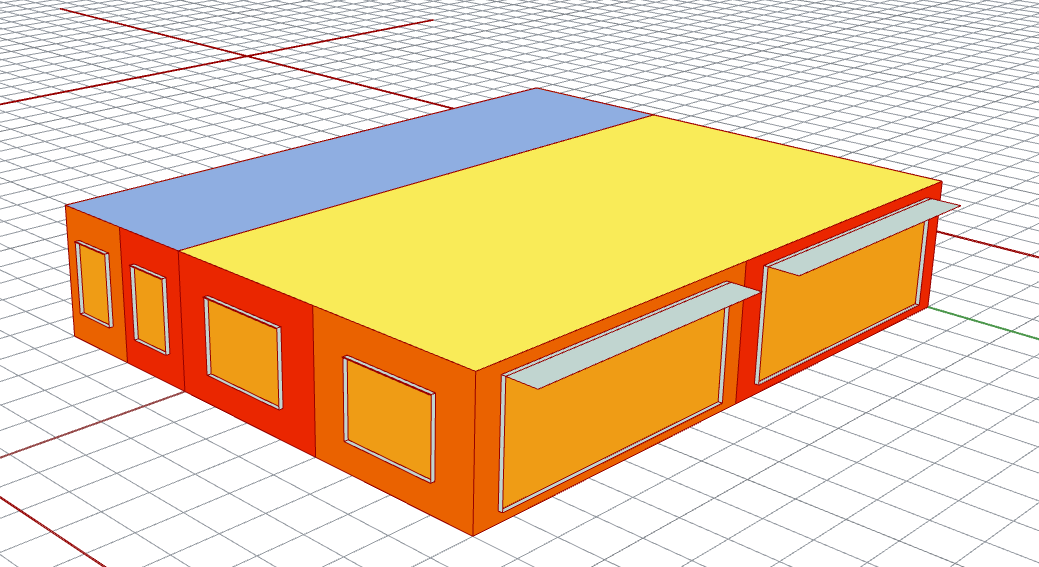
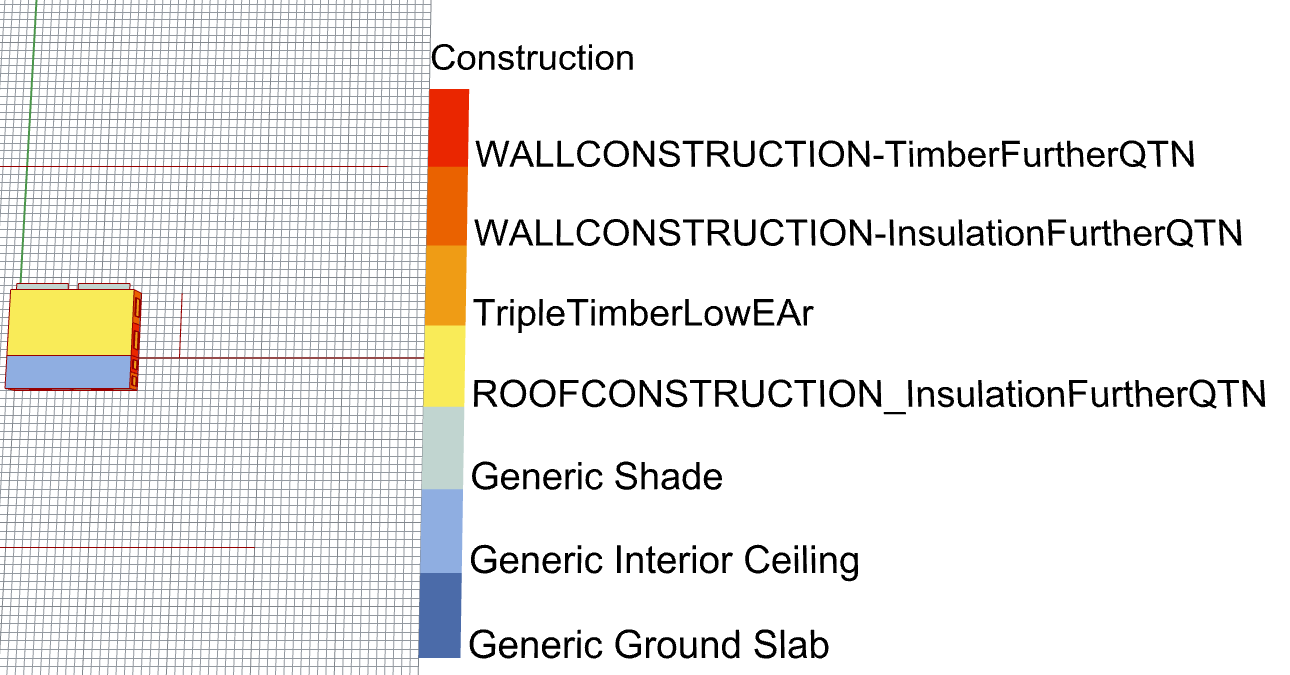
However, if I want to approximate the inside surface temperatures where there are thermal bridges, without going to a separate THERM or other thermal bridging calculation, then I have adopted a process of modelling the two thermal paths as two separate walls on each facade of a building: one, the external cladding, insulation, internal lining path; the other, external cladding, framing, internal lining path. I can ensure that as more (and therefore thicker) insulation is placed in the wall, the timber also gets thicker, and clearly adds to the heat capacity of that heat flow path.
With these construction labels
This works OK with two-zone models, where my students have complete freedom to set the %timber/%glazing/depth of wall/shading size etc.
However, as I move into a 5-zone commercial building model, (Where to insert window descriptions to ensure they are used?) I am rather hoping someone else has addressed this issue in a more elegant manner.
Suggestions welcome.
@MichaelDonn
Really interesting analysis, that unfortunately I don’t have any helpful advice for.
However, I am curious about the thermally bridged wall areas. It looks like they are consistently set to about 50% of your zone walls. May I ask how you determined this proportion? My intuition would have been the actual framing area is the only thing acting as the thermally bridged (i.e. there’s no further perimeter effect since there’s insulation everywhere else), and thus the thermally bridged area would have been a lot smaller then 50%. Am I wrong?
@SaeranVasanthakumar - please accept my apologies for the delay in responding.
Some 2 years ago we were commissioned to examine the % of a wall that was actually, rather than theoretically, timber. We were also interested in whether this was driven by on-site fixes to installation or standard construction practice. The general guide was that timber was 20% in the wall. Our analysis was for the buildings that we could get access to was some walls were up to 45% timber! This was due to internal wall to external wall connections; lintels over doors and windows; and other normal construction techniques in timber frame walls. We also looked at what software was available to model these kinds of construction issues. What concerned us is that many of these are not well dealt with by simulation programs that model buildings room by room, rather than one single space. What worries me is the idea of smearing an equivalent R value across a timber + insulation construction. We are aware that modelling the heat capacity of the timber in the wall is important. Smearing that across the wall concerns me immensely. I would love to be able to model temperatures on the inside of these structural components compared to the adjacent insulated parts of the wall.
I can make the report available. What was most intriguing from this study was that we demonstrated that simplistic heat loss calculations are insufficient: we found, counter intuitively, that if you operated the windows and heating and cooling of a house in the manner that we do typically in New Zealand then a wall with lower R value because of a greater than expected proportion of timber (40% instead of 20%) actually performed better! Actual performance contradicting the expected performance based on the simplistic physics of a Heat Loss calculation.
@MichaelDonn, sounds interesting, please make the report available.
I can easily see that the percentage of actual thermal bridging is underreported. However I do need some clarification on on how this makes an impact on the resulting energy results.
What worries me is the idea of smearing an equivalent R value across a timber + insulation construction. We are aware that modelling the heat capacity of the timber in the wall is important. Smearing that across the wall concerns me immensely. I would love to be able to model temperatures on the inside of these structural components compared to the adjacent insulated parts of the wall.
“Smearing” here refers to the area-weighted average of the wall R-value right? Is the concern that the specific heat capacity \left( \frac{J}{kg \cdot K}\right) of the timber isn’t also updated when updating the R-Value? Or is the concern the averaging operation itself? Or is the concern the aveaging out of the interior temperatures? Or all three?
I have seen BEM practices where patches of the higher-U-value thermal bridge component is modeled as a separate construction within the wall, like you’ve done. I had always assumed it would be roughly equivalent to an area-weighted approach since the R-value of the wall already has a small impact on overall EUI, but I could be wrong.
that if you operated the windows and heating and cooling of a house in the manner that we do typically in New Zealand then a wall with lower R value because of a greater than expected proportion of timber (40% instead of 20%) actually performed better! Actual performance contradicting the expected performance based on the simplistic physics of a Heat Loss calculation.
Was the simulation was performed with a higher (false) R-value, or was it corrected to account for the 40% timber framing (thus reducing it’s lower R-value? I’m trying to figure out if the critique here is about the inaccurate allocation of timber or inaccurate area-weighting method.
Kia ora
So the “smearing” that I was referring to is more accurately the area weighting of the heat loss converted into an equivalent R-value as you correctly point out.
When i modelled the differing amounts of timber in the walls using energy plus, and openable windows for much if not most of the cooling, then what I found was that the overall energy use for heating (!) was less for the building with 40% instead of 20% timber in the walls. Simple building physics heat loss would suggest that the building with lower R-value walls (40% timer) should perform worse than the building with 20% timber in the walls. Across the range of real buildings we were modelling this was consistently not true - the building with worse R values performed better. We concluded that the operation of the natural ventilation (openable windows) AND the real areas of glass facing non-optimal directions were far more important for the overall performance of the 9 buildings we looked at.
@MichaelDonn
Very interesting… so you modeled two options with a higher and lower R-value, and the building with the lower R-value had less heating! Were you able to identify what was the cause of this, i.e. use a thermal energy balance to spot what changed between the two runs? Also, was it only heating that reduced, I would expect the cooling to reduce before the heating.
This kind of seems consistent with what I would expect in a very mild climate where active conditioning isn’t used much. Specifically, it reminds me of the building typology you see in the tropical countries with no mechanical conditioning: low-R, high-mass buildings. (which, is directionally similar to the envelope you’re creating if you swap insulation for heavy timber).
Lower R-values are actually helpful for cooling in such mild contexts which aren’t reliant on AC, since a high R-value would just trap you with high internal/solar heat gains. The basic idea is that if the balance point temperature[1] is slightly lower than the modal temperature, lowering the R-value actually brings the balance point closer to the modal temperature.
And the high thermal mass in such typologies obviously helps during the cooler evenings. I wonder if this was what contributed to your heating energy reduction. Specifically, doubling the timber, and reducing the insulation might have contributed to some extremely minor passive heating in the evenings via thermal storage effects.
[1] T_{bal} = T_{cool} - T\left( Q_{int} + Q_{sol} \right) \cdot R_{env}
Kia ora
As I mentioned, it was the operation of the openable windows and the orientation of the glazing that contributed to the phenomenon. It was a small effe3ct
@MichaelDonn
Thank you for your patience, and I apologize for continuing to ask questions, but I feel like you’re referring to something I haven’t quite grasped yet. Perhaps you should just link your report 
Anyway, onto my questions:
The operation of the openable windows and orientation of the glazing doesn’t change between the different simulations (since the only difference is the envelope construction), so I’m still not sure what the cause of the difference is. Are you saying the difference in R-value resulted in a heating/cooling difference that was in turn due to some combination of: energy loss/gain from natural ventilation airflow, solar heat gain, and/or heat conduction via glazing that was oriented in a non-optimal direction? Also what does non-optimal mean? Is it non-optimal for cooling due to solar, wind or both?
Kia ora @SaeranVasanthakumar .
I agree this at first seems bizarre. After all, if the heat loss properties are higher for the building with the lower heating energy use, surely we are breaking the basic laws of physics?
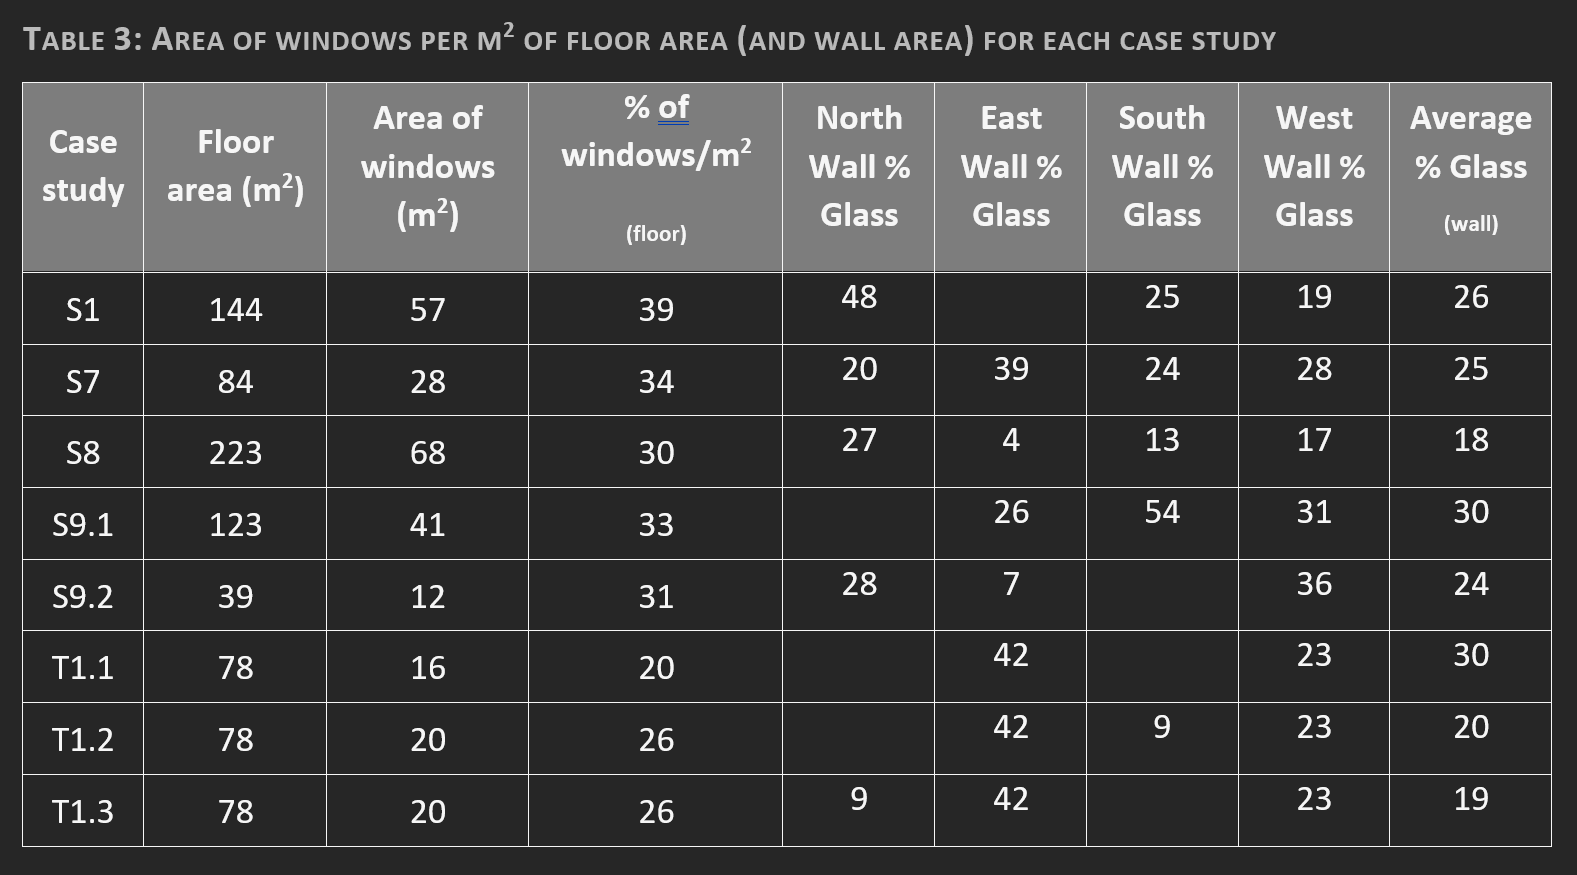
First, let me illustrate, for context, the differences for all the buildings (remembering that we are in the Southern hemisphere, so solar noon is North):
So: non-optimal for me means large windows and many of them not oriented to solar noon.
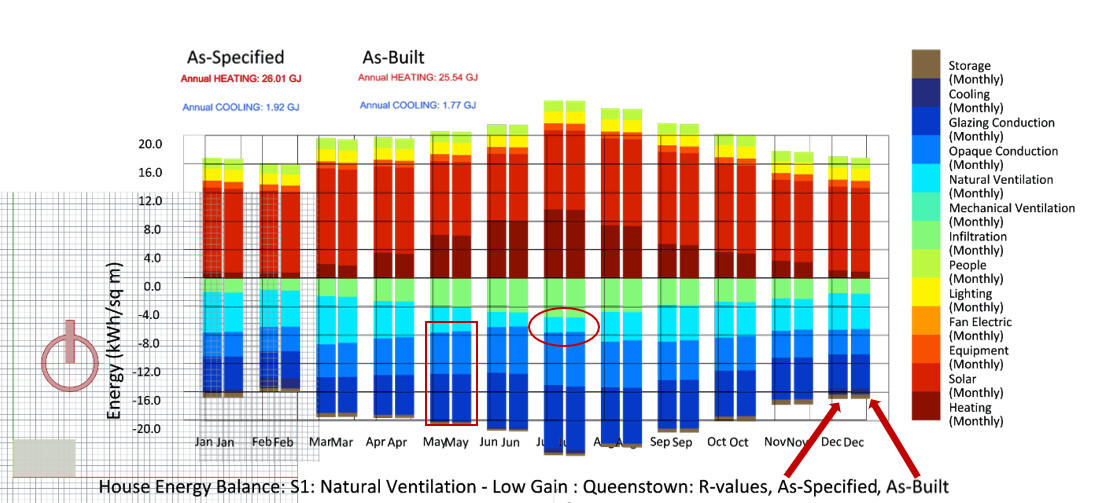
Then, we come to the differences between the performance of a building “as-built” - where the building has been modelled with the actual timber % in the walls - and the performance “as-specified” - where the model has only 20% timber in the walls.
And this is where the energy balance equation is very revealing: the heat losses through the opaque fabric are slightly higher in the as-built model - as the heat loss physics equation would lead us to expect. The other histogram in the square highlight box shows the heat loss through the glass is the same - reassuring, that there is not some weird happening. What does differ is the cooling due to openable windows.
I agree with you that prima facie the openable windows operate the same; but, in reality, triggering the windows to open and close when a building reaches a particular temperature means that if the buildings are heating and cooling differently because of their heat conduction properties, then the combination of input heating energy and openable windows will not be the same! Most intriguing, and a lesson in the necessity of not looking just at the heat loss equation.
@MichaelDonn
Thank you very much for this detailed explaination, and indulging my curiousity.
And this is where the energy balance equation is very revealing: the heat losses through the opaque fabric are slightly higher in the as-built model - as the heat loss physics equation would lead us to expect…What does differ is the cooling due to openable windows.
Yes, it’s hard to make out, but I agree the as-built representation walls seem to have increased heat loss, but the net heat energy is still lower due to reduction of heat loss from natural ventilation.
I agree with you that prima facie the openable windows operate the same; but, in reality, triggering the windows to open and close when a building reaches a particular temperature means that if the buildings are heating and cooling differently because of their heat conduction properties, then the combination of input heating energy and openable windows will not be the same!
I wonder if we can narrow this down to a very specific dynamic: conceptually, the heat loss from the envelope, relative to the exterior air, effectively shifts a too-low minimum ventilation setpoint “higher” by shifting the interior air temperature lower. What I mean is[1], say the model’s minimum ventilation (interior air) setpoint is too low, such that it triggers the mechanical heating during the cold evenings. However, in the as-built building with higher wall heat loss, the interior air is likely a little cooler on average, which means you end up with the funny side-effect that the minimum ventilation (interior air) setpoint is hit when the exterior temperature is warmer (relative to baseline case). The warmer exterior temperatures may be enough to avoid hitting the heat setpoint, and the cooler interior air is just marginal enough it doesn’t result in a disproportionate increase in heating loss. The end result being you avoid the high heat loss from open windows during evening heating periods because of the lower-R walls.
Anyway, I’ll conclude by saying I agree with your interpretation, and I am convinced my earlier speculation about potential warming effects from changing the thermal mass quantity is definitely incorrect.
[1] This example assumes that the minimum ventilation setpoint for opening condition is based on the interior air, and it is a couple of degrees higher then the heating setpoint.
Kia ora @SaeranVasanthakumar.
To be honest, I have valued the dialogue as it is always helpful to test one’s thought processes against the thinking of someone else who understands the underlying physics and the limits of modelling.
You are correct in your assumption about the set points for the ventilation.
I would add that I have in general some interesting thoughts about how to set the natural ventilation set points to best model how people work.
For example, having a heating set point at 18C indoors, an open window set point indoors of 22C and a cooling set point of 26C makes some sense in our mild climate. But, what if it is a sunny day in winter: outdoor temperature 10C; indoor temperature 23C; wouldn’t we open the windows as the sun kept heating us up? In reality, we might leave it for a while (human inertia) but eventually we’d open the windows. But, after 10 minutes we’d probably close them again as all the heat has dissipated. But, in modelling the windows are often open for the whole hour that the temperature is “too” high; the model then predicts a radically increased heating energy need. Intriguing.
@MichaelDonn
To be honest, I have valued the dialogue as it is always helpful to test one’s thought processes against the thinking of someone else who understands the underlying physics and the limits of modelling.
I’m glad to hear it, since somehow in this whole thread the original question was completely neglected!
For example, having a heating set point at 18C indoors, an open window set point indoors of 22C and a cooling set point of 26C makes some sense in our mild climate. But, what if it is a sunny day in winter: outdoor temperature 10C; indoor temperature 23C; wouldn’t we open the windows as the sun kept heating us up? In reality, we might leave it for a while (human inertia) but eventually we’d open the windows. But, after 10 minutes we’d probably close them again as all the heat has dissipated. But, in modelling the windows are often open for the whole hour that the temperature is “too” high; the model then predicts a radically increased heating energy need. Intriguing.
Yes this really captures the limitations of trying to set natural ventilation with just setpoints. Personally, I think this is where some sort of predictive component would be useful to calculate optimal window states on expected air temperature given exterior and interior sensor measurements. Specifically, Bellman’s equation[1] (used in Reinforcement Learning (RL)) is I think a perfect fit for this problem: it dynamically learns to associate state actions with not just the expected performance output from a given action, but also the expected future performance output from that action. So to address your example, the fact that it can predict some combination of immediate and long-term performance output should allow it to gradually start closing the window in anticipation of the performance dropoff, even in the face of no immediate consequences.
[1] Bellman equation - Wikipedia