Multiple storey daylight analysis - showing one floor at a time

My class is happily producing 16 room analyses across multiple floors of a building - gaining confidence starting with the excellent sample files and developing their own models and analytical questions.

However, when we produce the annual DA / UDI index spatial plots we can only see the map for the top floor.

The work around is easy in one sense: create multiple duplicate work flows one for the rooms on each floor. I cannot help but feel this is a messy, and with many more stories than we are studying, prone to error exercise.

No matter how I try, I cannot feed the multiple floors of rooms into one single annual daylight component and then parse the output into esch floor’s spatial map.

If the answer, presumably in grasshopper, not LBT, is obvious, I’d be very grateful for the guidance.

There are two methods to solve you question.
Method 1 : you can using Grasshopper Tree branch compotent to split annual DA / UDI to multi branch. You should make the DA / UDI and mesh of floor is matched.
Rhino_0wZ2L5uDHG

Method 2: you can use clipping plane in Rhino which can modify the viewport for Rhino.
Rhino_vNKNVahIhp

Thank you so much. I will post the solutions we arrive at on here on Monday from the class.

I will work through what “Path” looks like for the Modified Annual Daylight Sample File

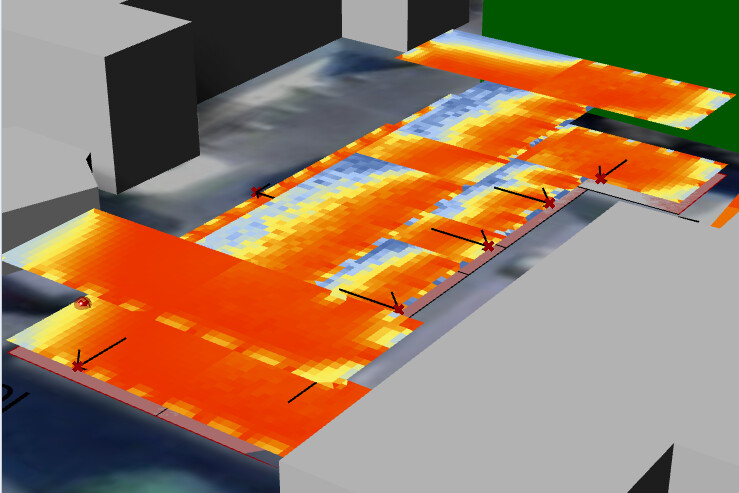
This class is adding geometry (surrounding buildings from a publicly available GIS source) to the LBT Sample files.
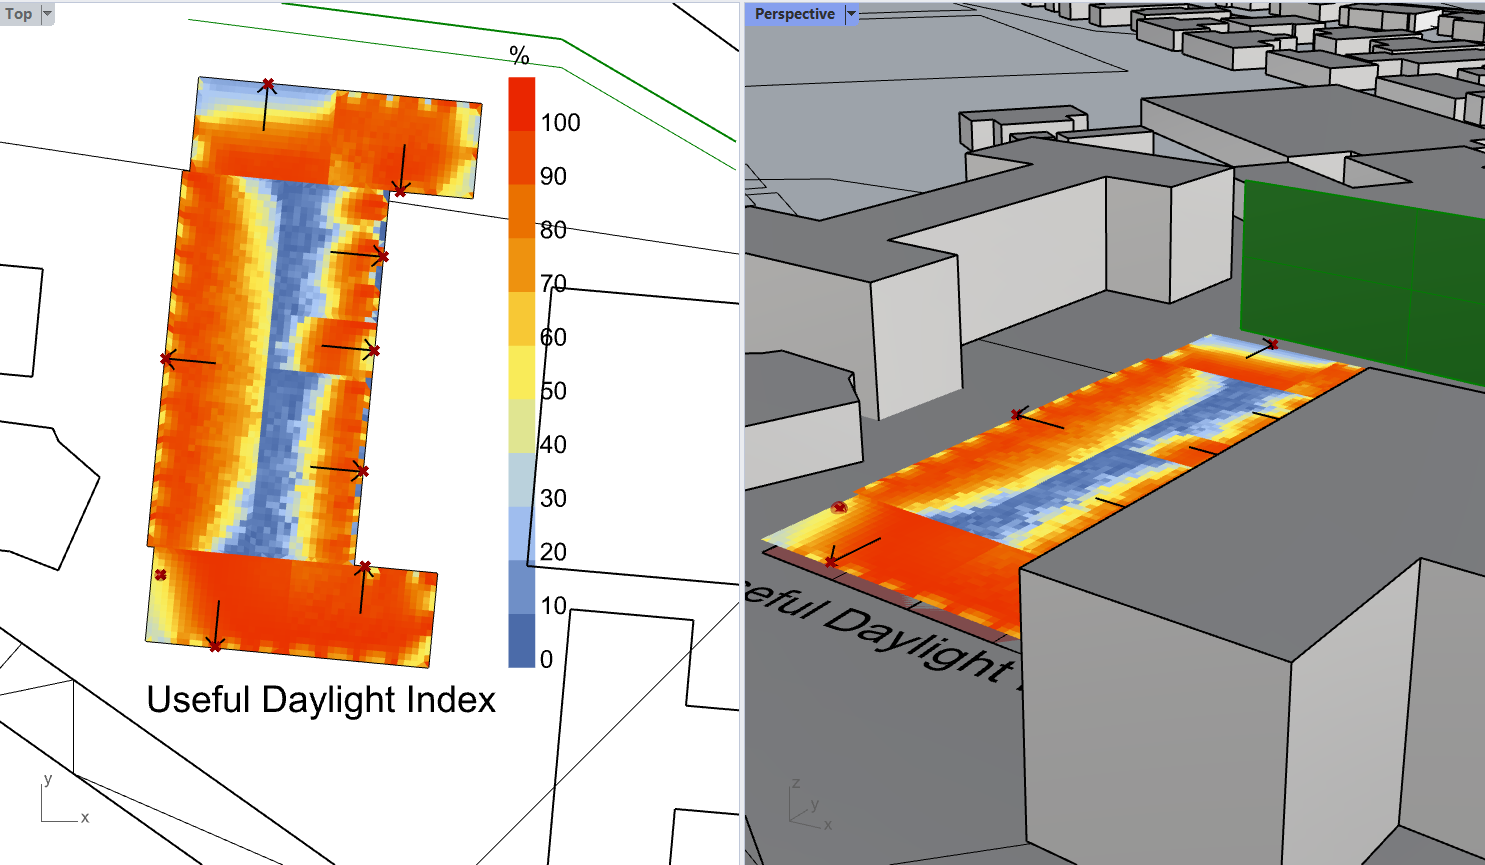
An H-shaped two-level file run through the annual daylight Sample produces this:


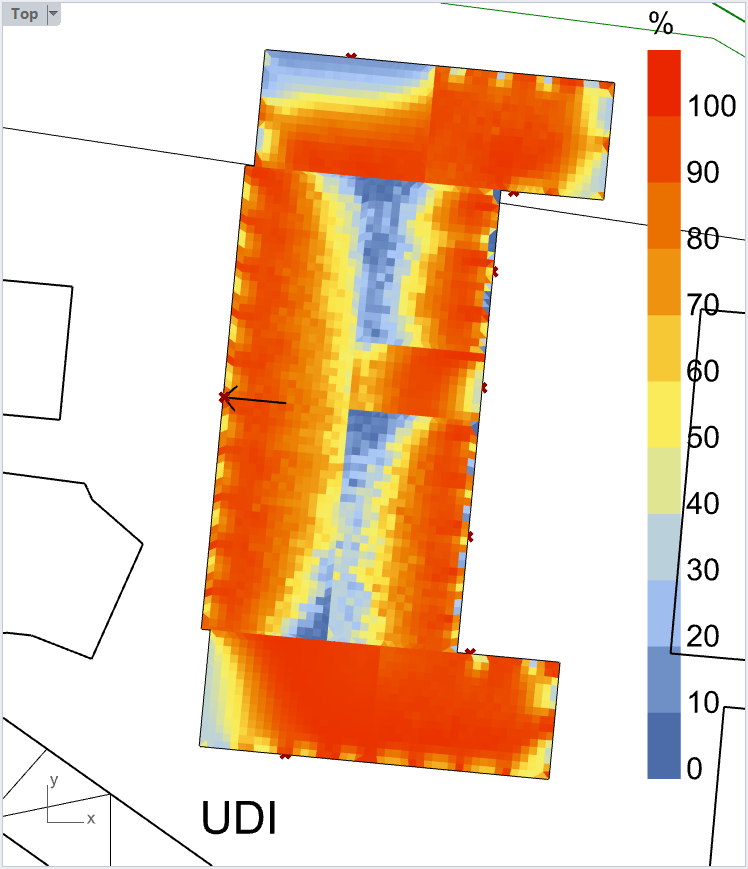
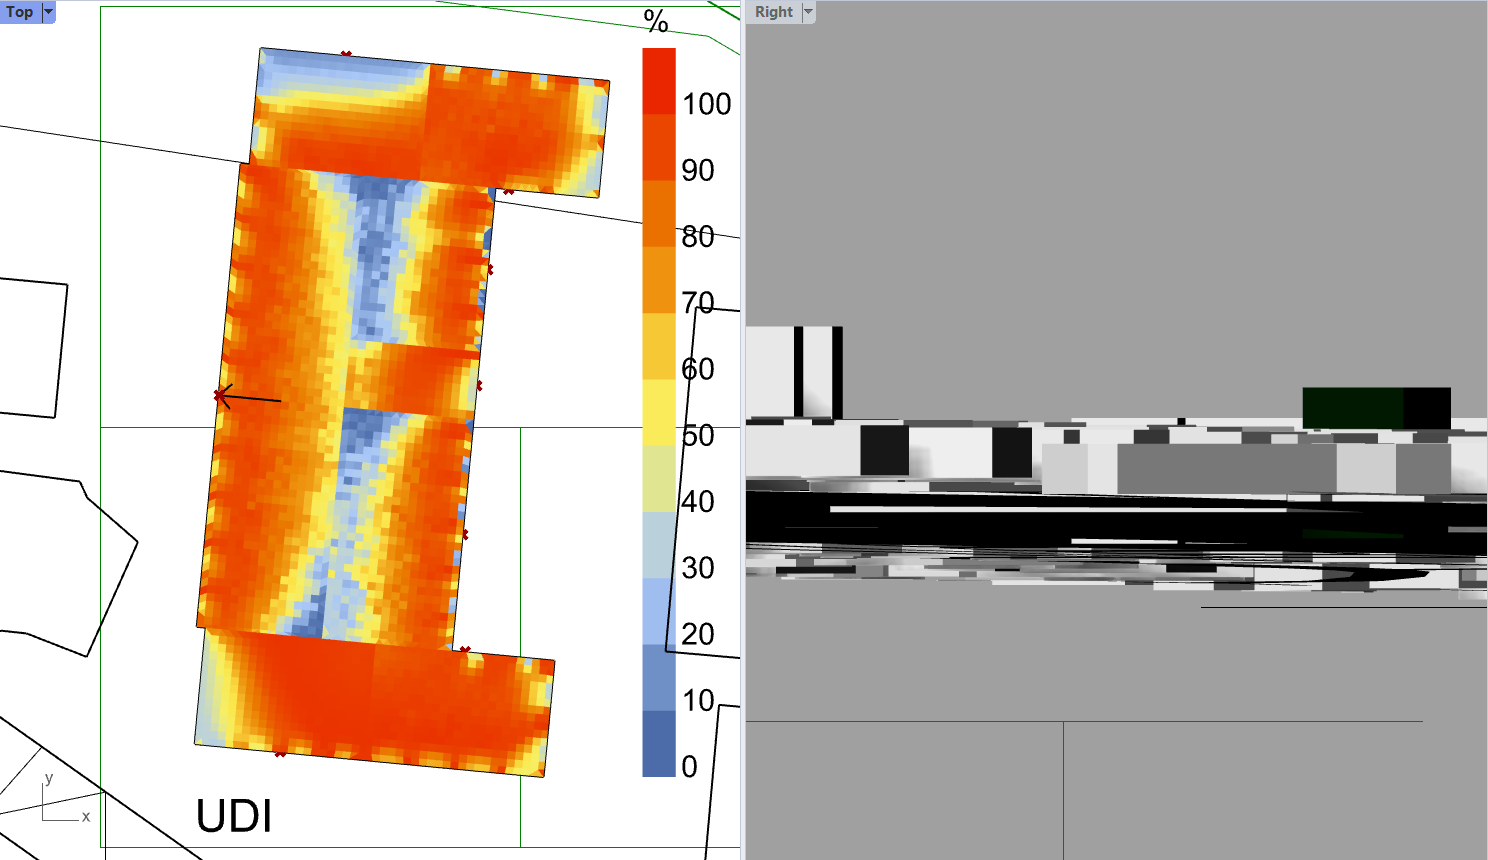
Of course, in plan view only the top floor is available:

FIRST OPTION
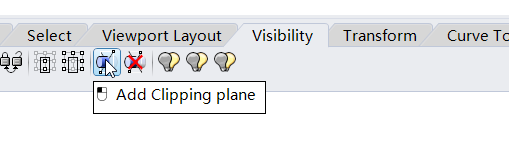
The first option, the clipping plane
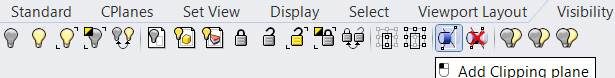
image
Works this way:
Click in the view you want the clipping plane to work in, then select the Add Clipping Plane button and draw it in the view that you want it to be drawn parallel to. Note: in image below, the plane is drawn in window on the left, and its position in space is the green line in the window on the right:


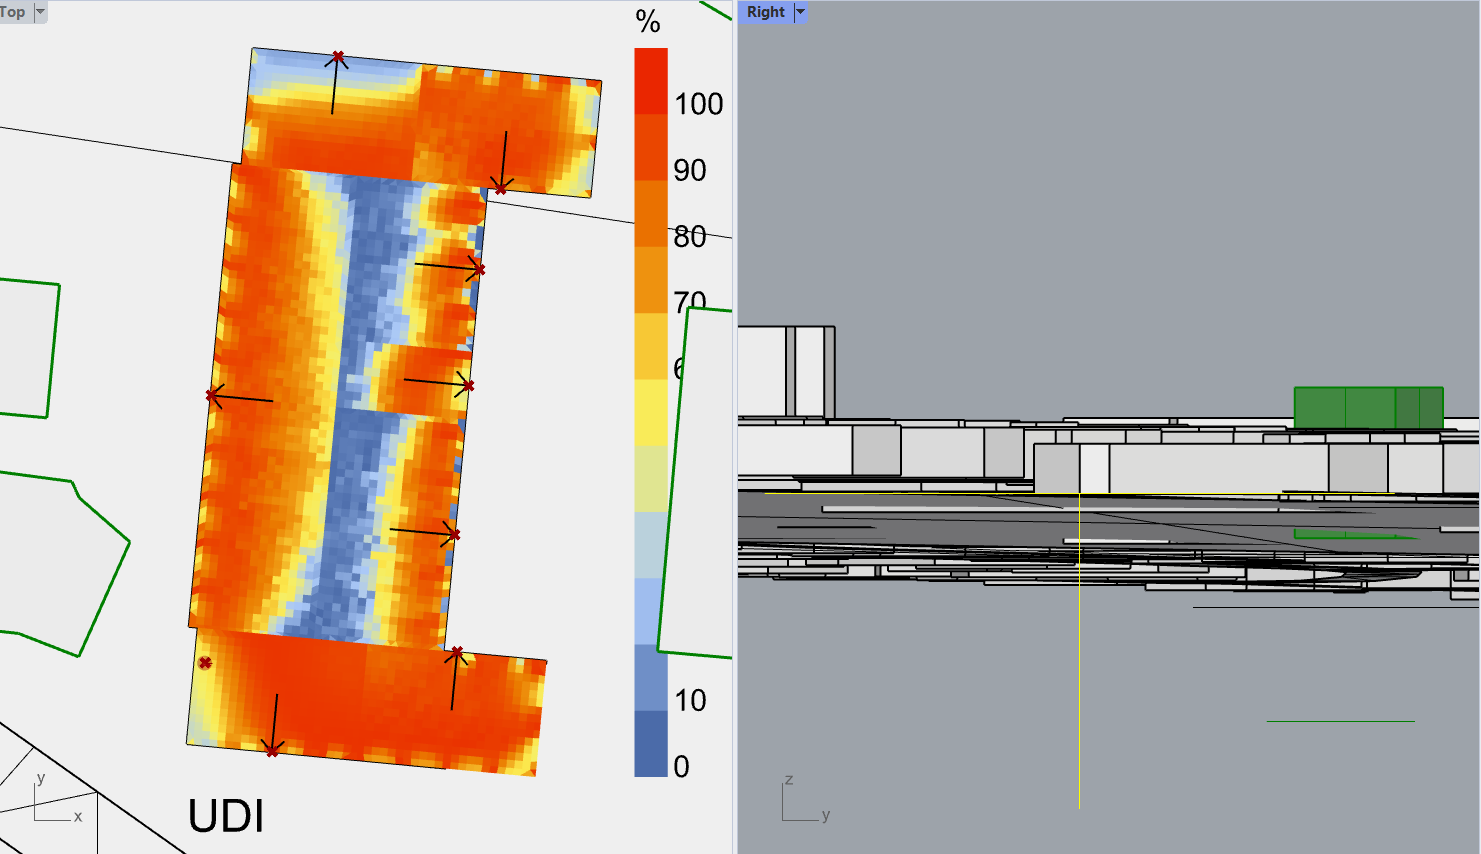
Moving that Green line up in the Right Hand Window allows a view of each level:

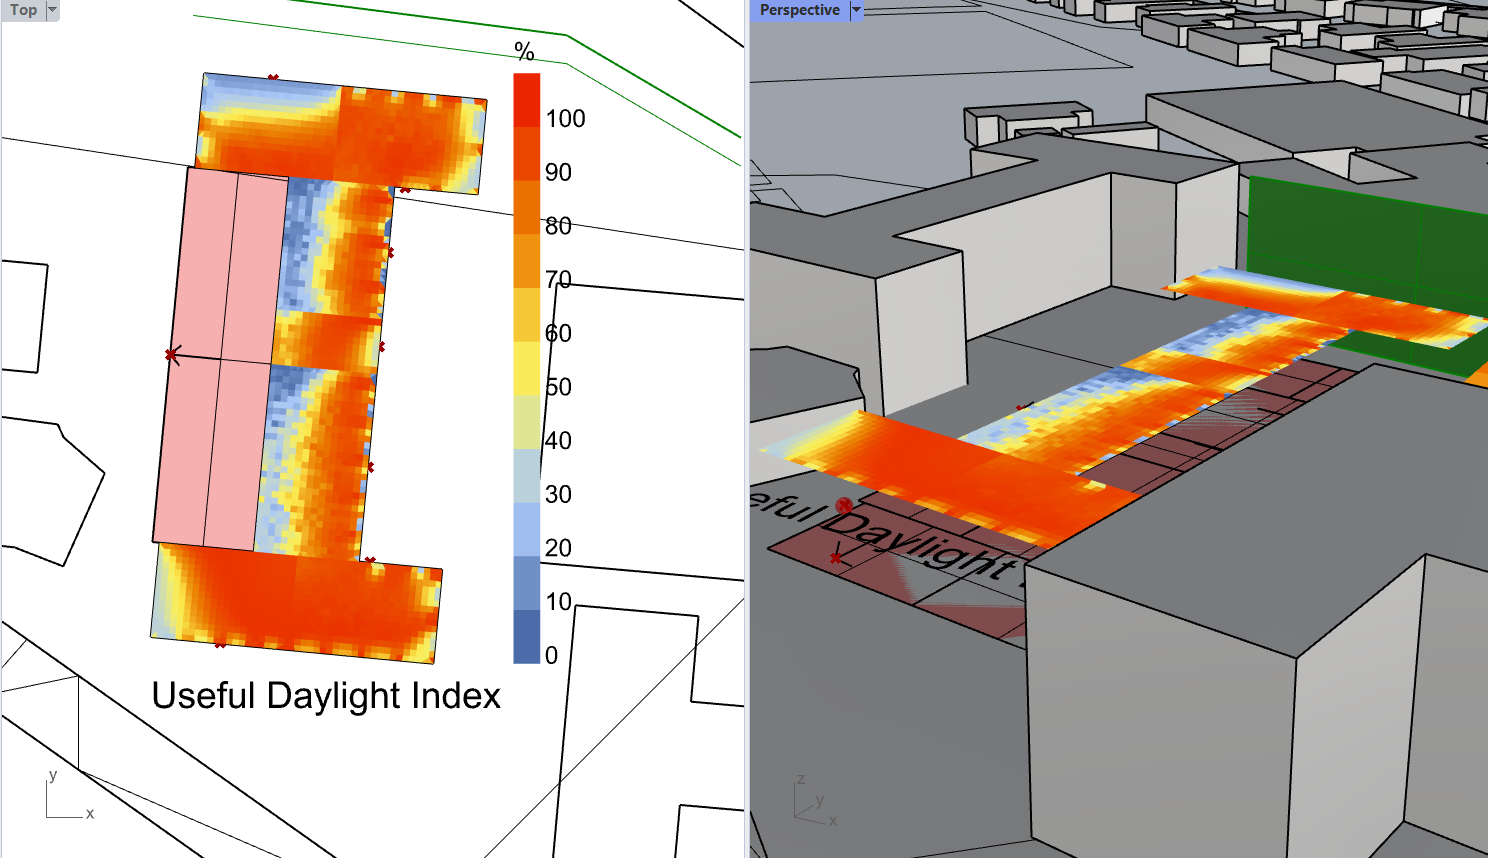
BUT: the building we are rendering has a different plan on the top floor:

In this situation, one of the lower floor rooms with no top floor room over it appears in both renders.

SECOND OPTION:

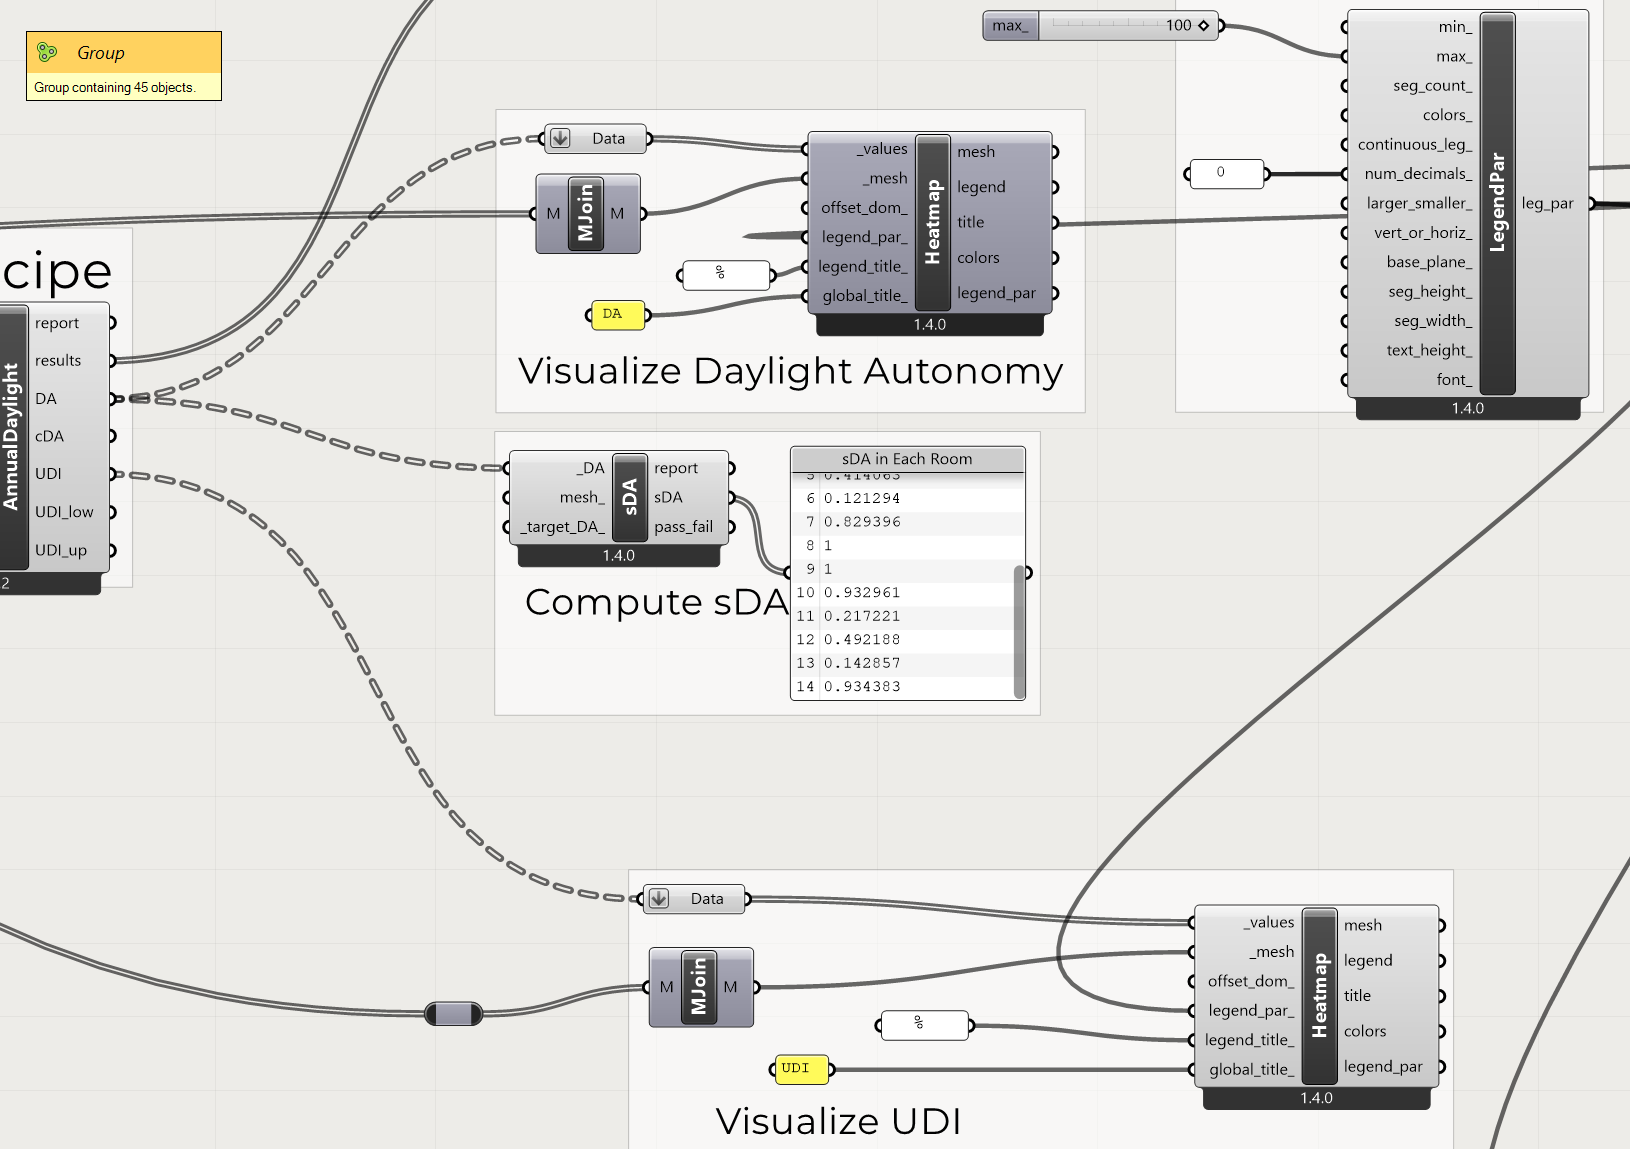
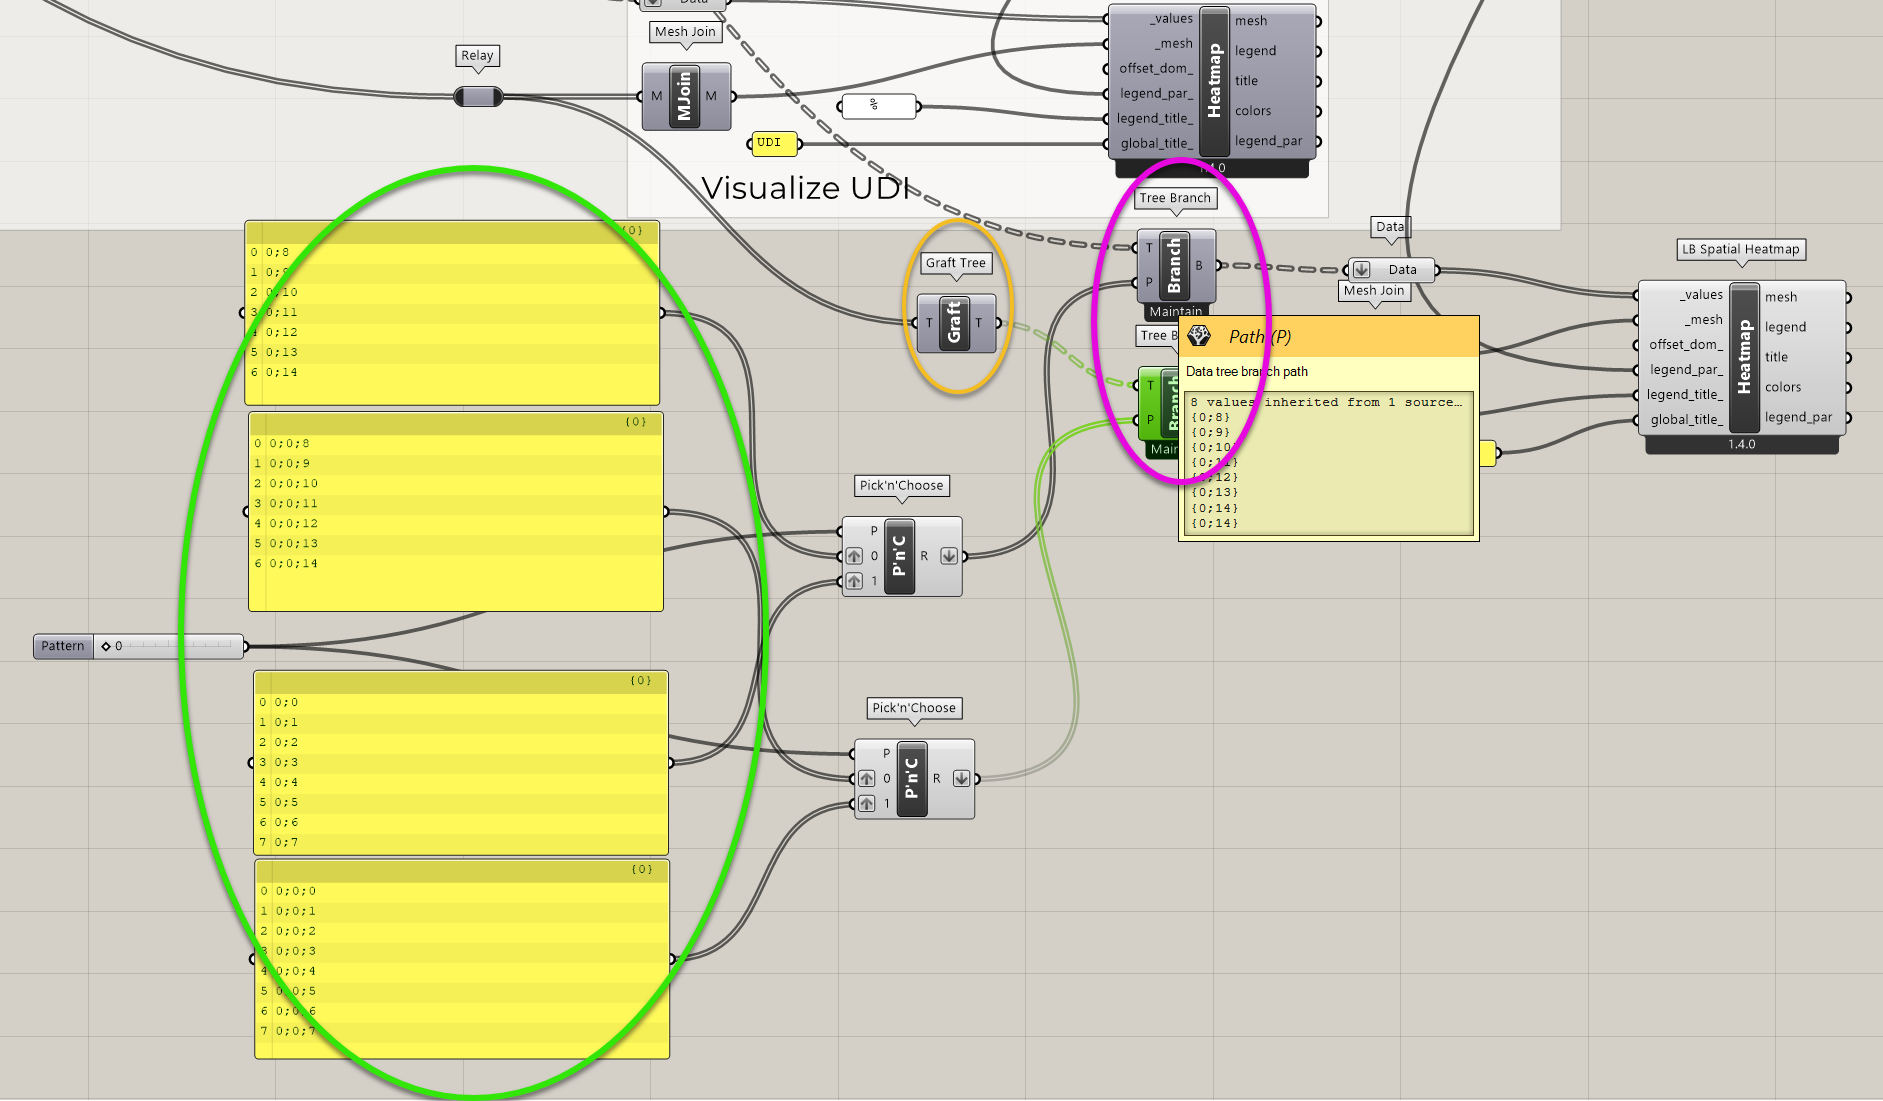
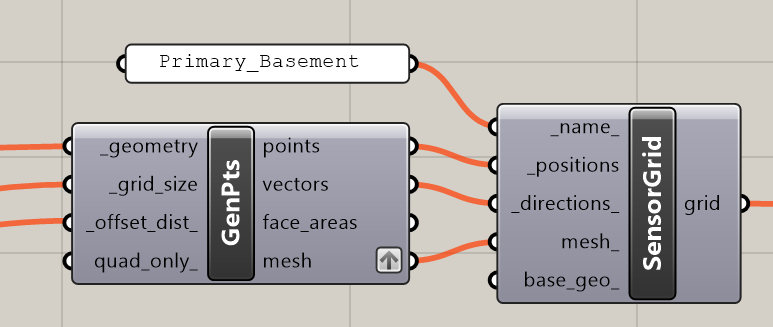
We start with the part of the sample script with the students’ geometry as input.

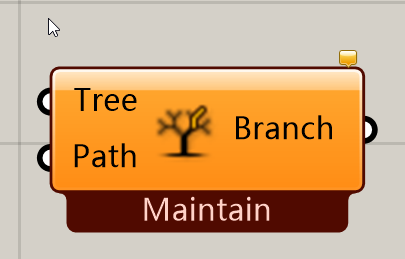
And we want to add the BRANCH option as suggested. We will need to branch the data and the Mesh.

We start therefore before the MeshJoin component, and before the Data Component.

The Pink circle shows the two Branch Components inserted.

Note: (Yellow Circle) the Graft Component seemed to be needed, to make the Mesh Branch work.

Note Also, the two sets of panels: They are the addresses for the P (Path) input to the Branch Component. The data seems to require a format for each branch to be selected of 9;0 and 0;1 etc And, the mesh to require a format of 0;0;0 and 0;0;1 etc. The last digit in these runs from 0 through 7 for the lower floor Rooms; for the upper floor, they run from 8 through 14. I hope to figure out how to automate these numbers soon by counting the rooms on each floor. For now, these are hard-wired.

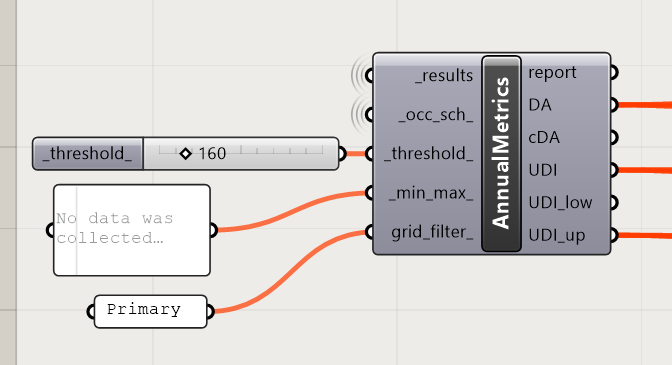
The Data and Merge components are now placed AFTER the Branch components so that the LB Heat Map component produces only one legend scaled to the size of the building, not a legend per room scaled to the size of the room.

Note: on the extreme left of the above script, there is a slider set to 0. This allows the Pick 'n Choose Components to select either the lower or upper floor for display.

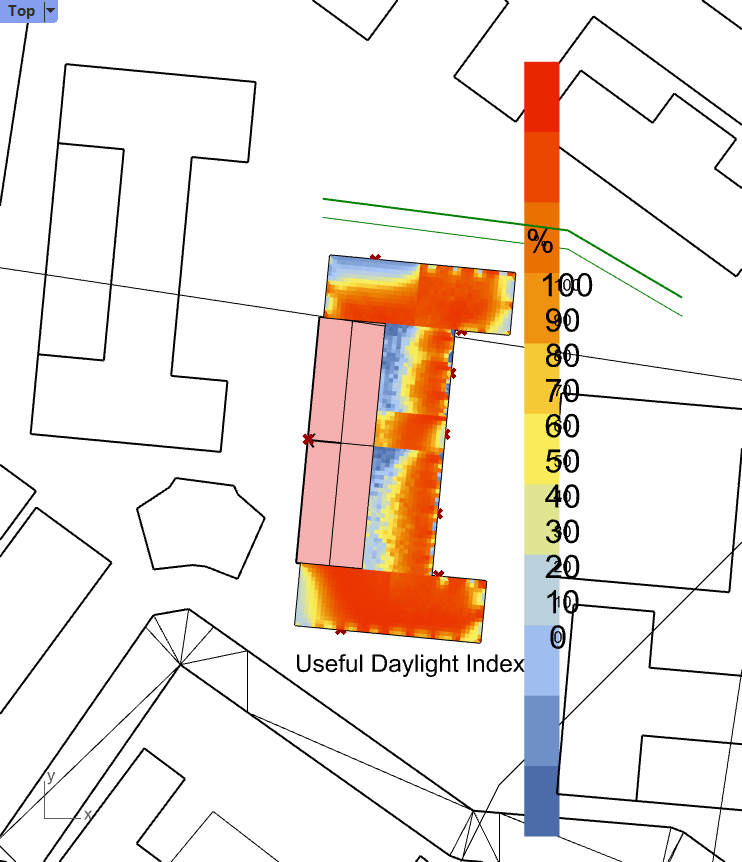
AND FINALLY: a curiosity.

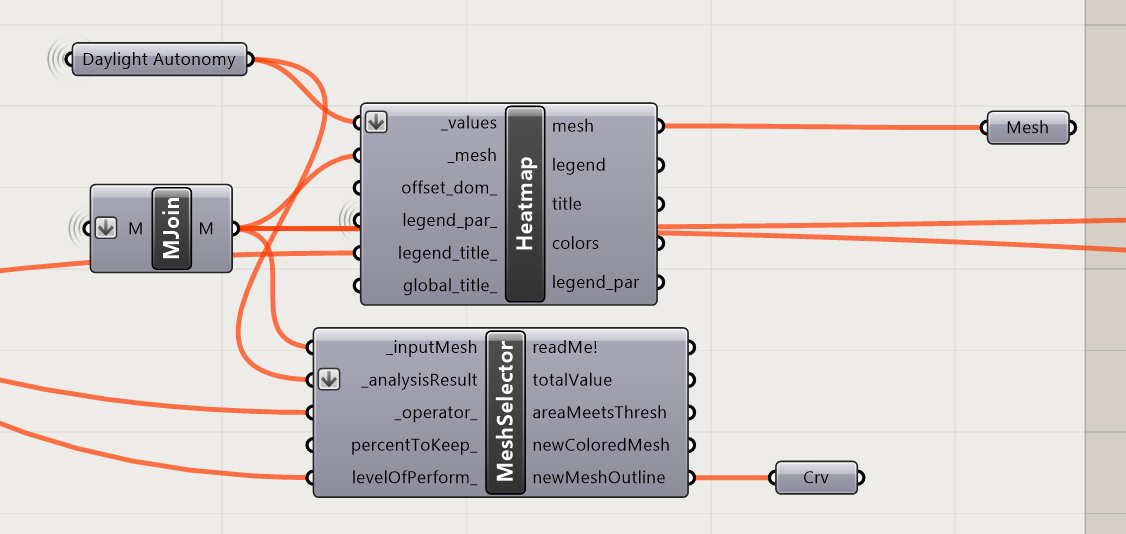
I have tried the well-known technique of turning of Preview on the HeatMap component and then feeding this into Custom Preview to try to beter control and scale the legend. Scale affects the mesh, but not the spacing of the text, and Custom Preview works in Shaded View in Rhino, but not in Rendered View.


Rough example of scaling the legend:

2 Likes

I have the same problem. However my building being a residential development has many more HB Rooms. I would prefer to use the Grasshopper solution mentioned above but I am finding it difficult to follow from the description given. I am wondering if it is because I have named the HB Rooms and not left them blank.

I have tried to replicate what was done but have run into problems where I am trying to separate the data from the HB Sensor Grid component so as only to run the ground and first floor. The screen shot does not show all of the script around where the result is placed. Are you able to provide a copy of the file?

dragonfly_example_withDaylightToEnergyPlusGlare_v2.gh (340.7 KB)
The attached gh file has the relevant code in pink.

Unfortunately the Rhino file that it links to is too big to upload, and internalising the data is not apparently an option with the pipeline option I have use in this development model.

Please excuse the messiness of this, it was never intended to be distributed, it was a development and testing platform of what the students were working on.

Hi Mike,

I came across this recently on a project, where we wanted to show different floors and extract the results for specific room types (i.e. primary vs secondary spaces for Green Star). The solution was to create the grids specifically for the output you’re after and then use the HB Annual Daylight Metrics component to read the results. The input for ‘grid_filter’ can be used to filter to only those grids you’re after.

Example:


image

You then use the mesh from the grid generators, and the DA output from your filtered data. Make sure you ‘join’ the mesh to visualise several meshes together. The below is my workflow. I actually came onto the forums to find out if the ‘mesh selector’ component is within the new versions yet, as currently I am still using it from the legacy ones.

Hope this helps! The output of this means that I can connect only the grids I need to for analysis, rather than running entire floors together.

Elly

2 Likes

See here: Daylight Autonomy results as a single tree branch - yet have multiple zones