I am recently testing thermal comfort of a shoebox with the PMV comfort model.
Given my relative newness to the topic, I’ve experimented with various strategies (such as orientation, WWR, shadings, material properties, natural ventilation, exhaust fan, mechanical ventilation, etc.) to ensure compliance with PMV category II (-0.5 < PMV < +0.5) and PPD < 10%.
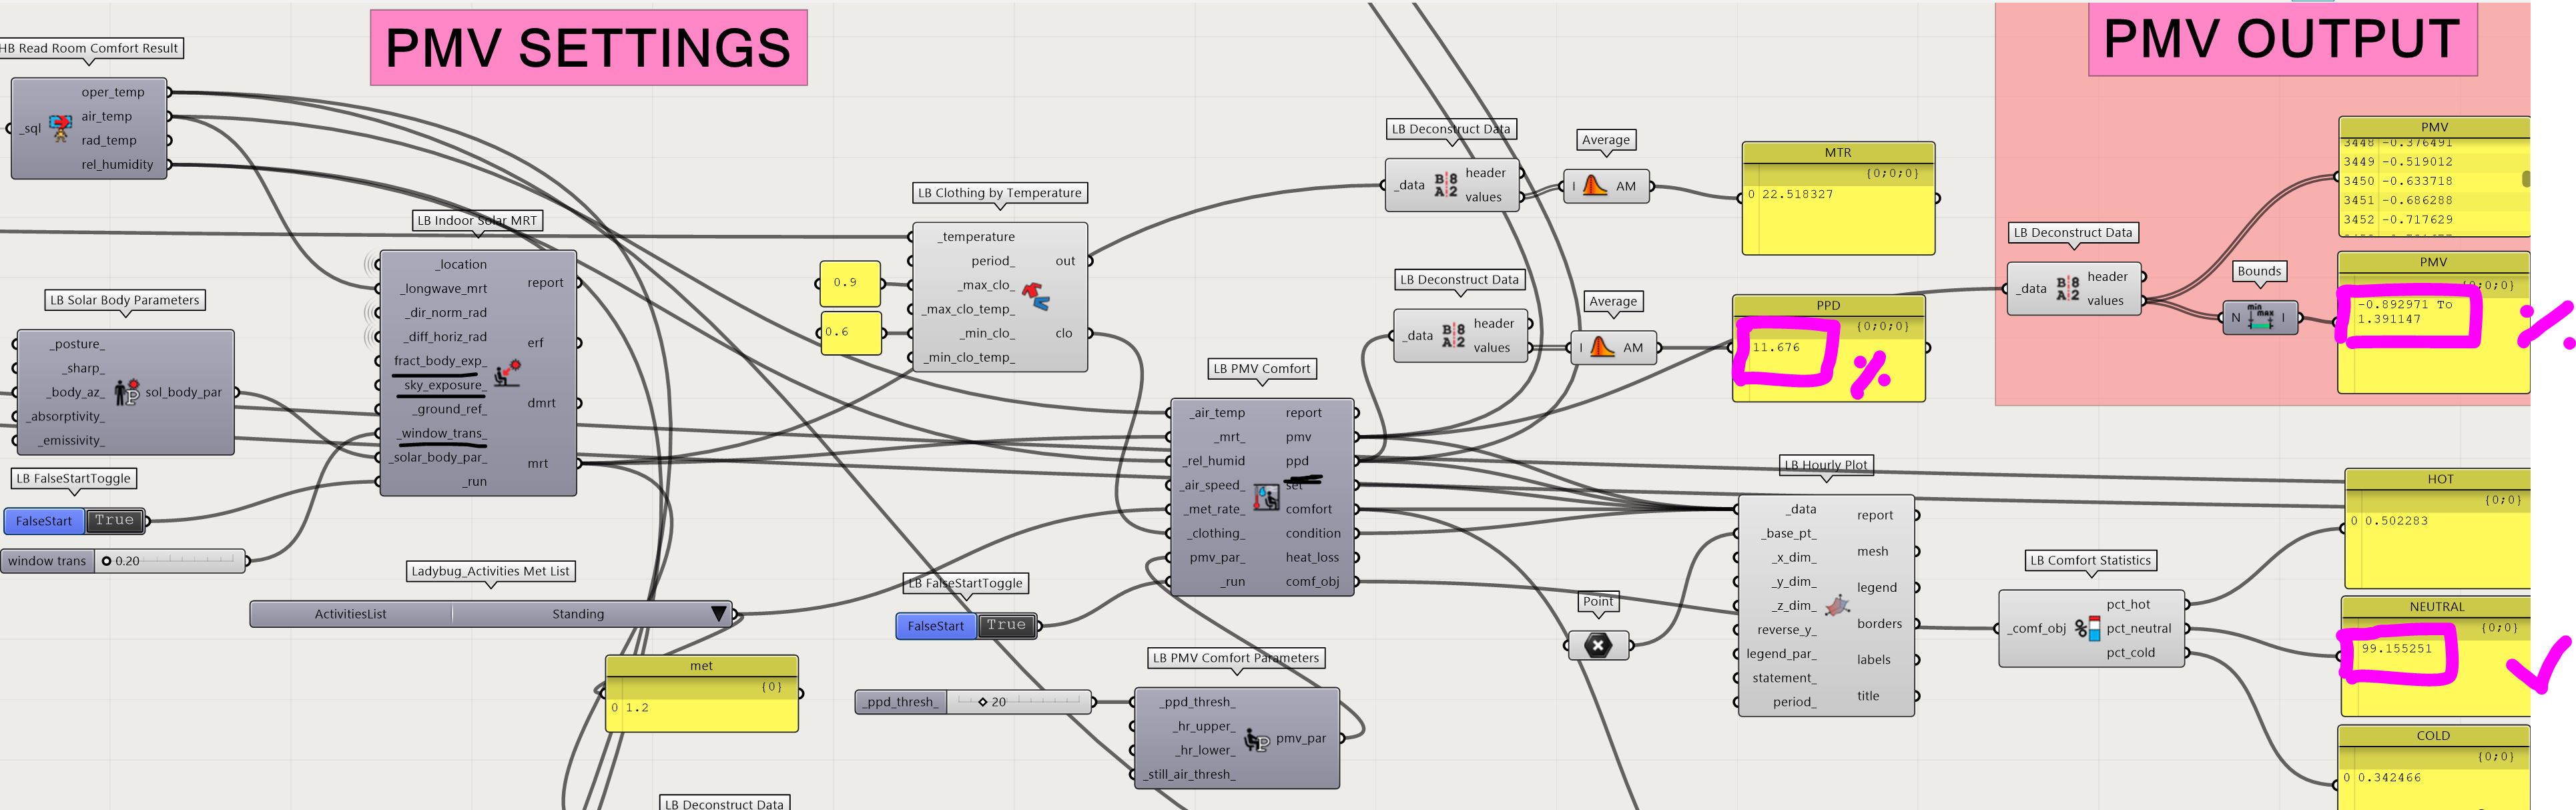
Despite achieving a 99% pct_ Neutral in the comf-obj output of the LB PMV Comfort, I’m unable to meet the specified PMV/PPD requirements. Therefore, I would appreciate clarification on the standard to which the comf-obj refers and insights on achieving a space that aligns with PMV and PPD requirements.
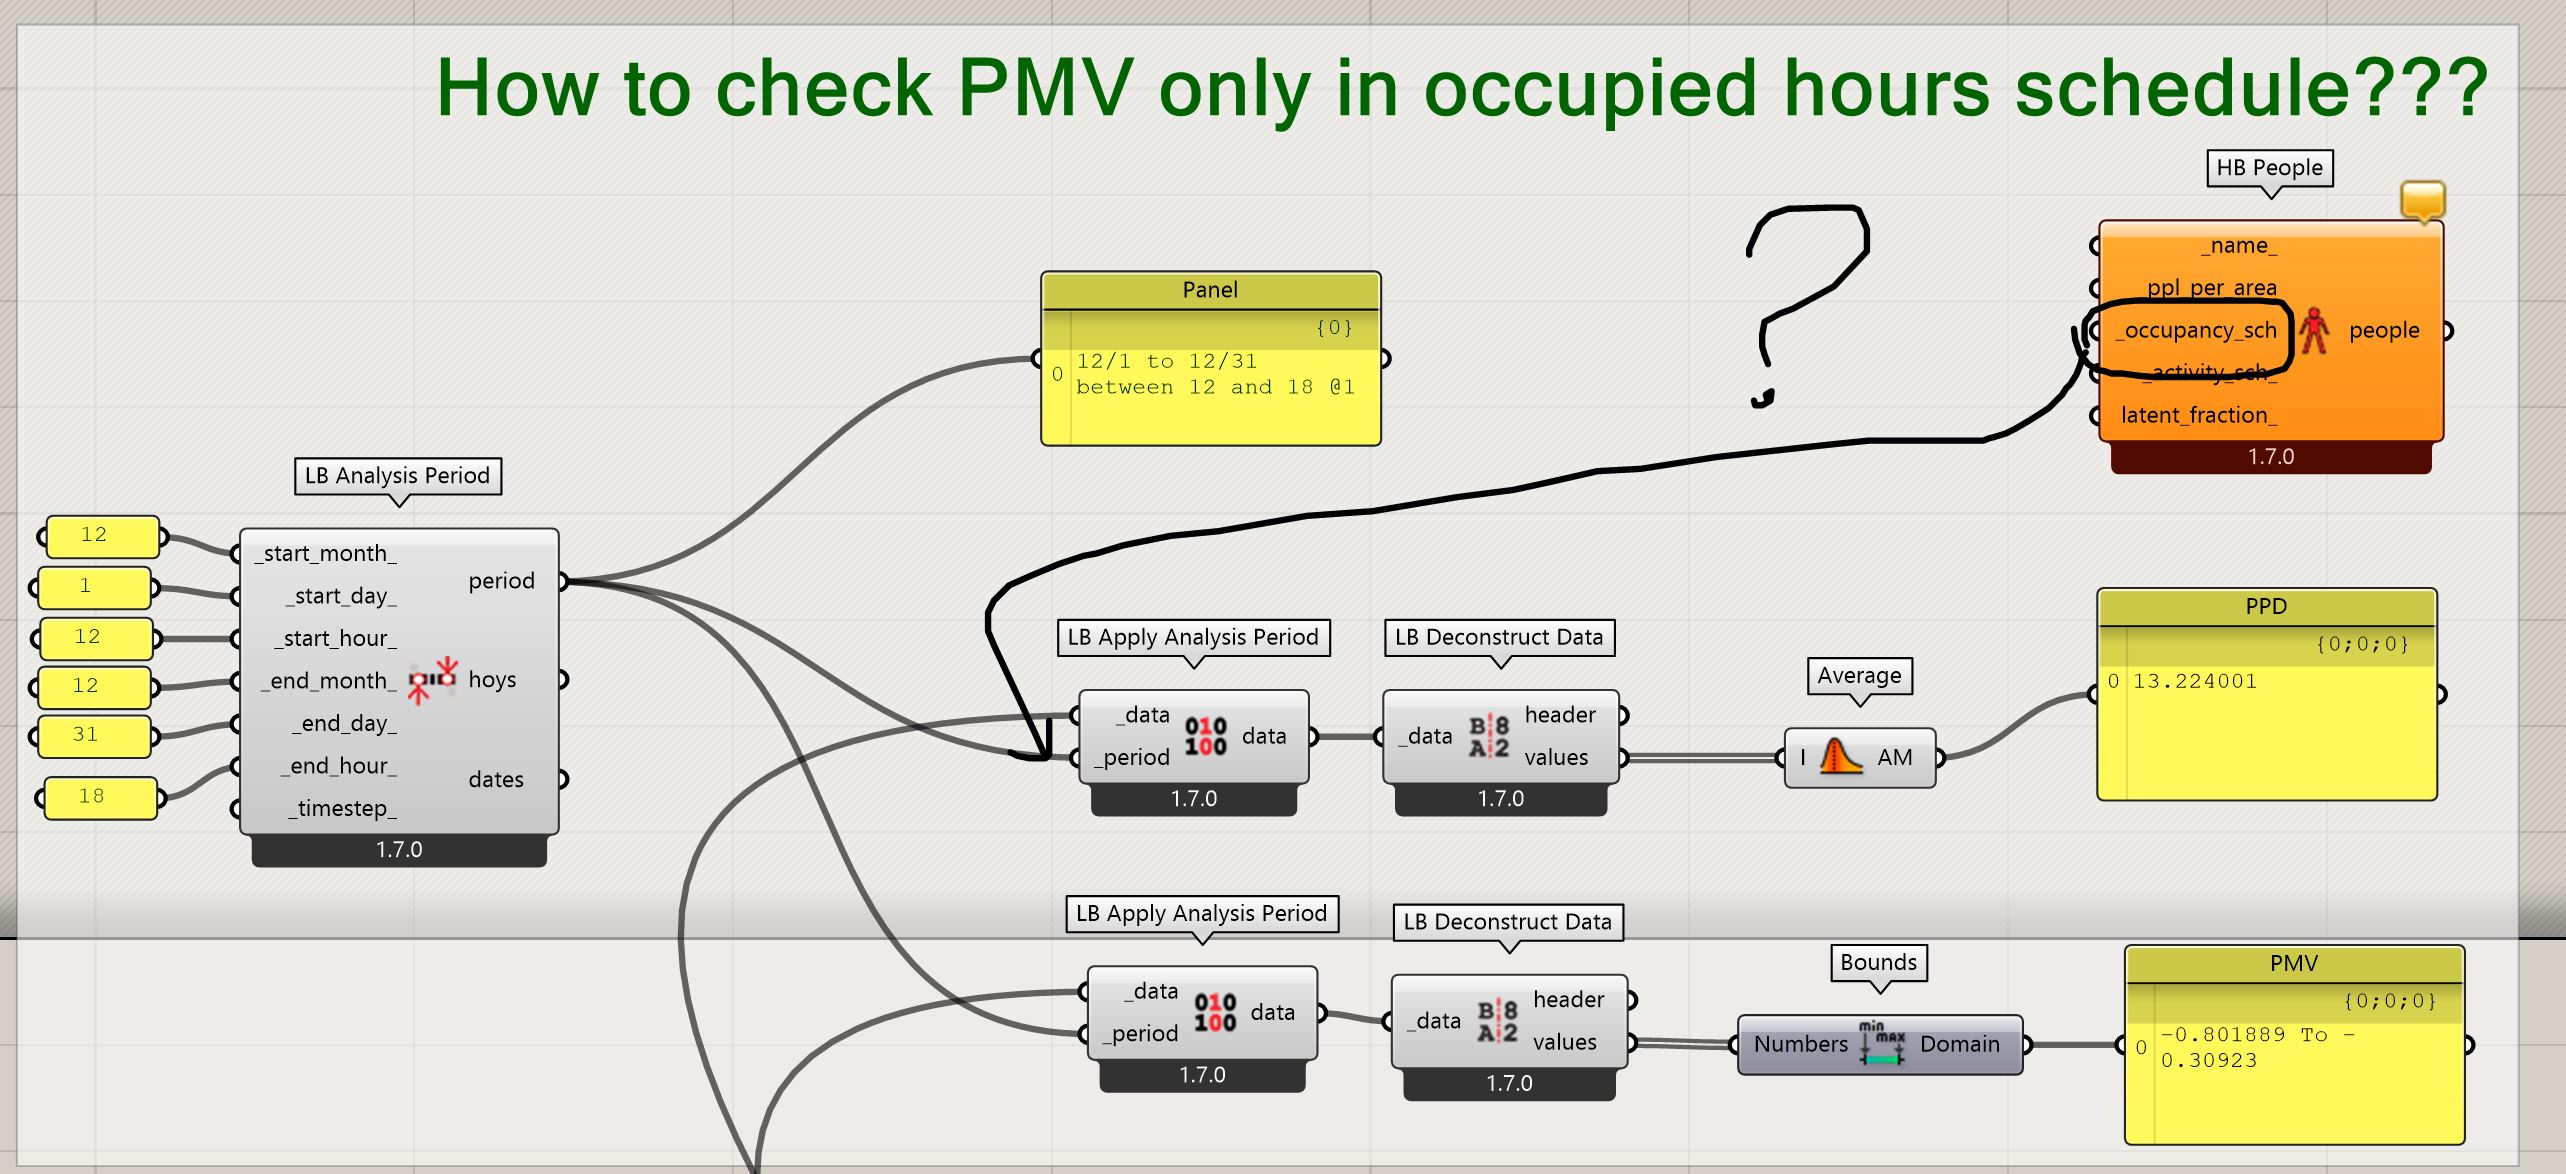
Additionally, I am curious if there’s a way to specifically check PMV during occupied hours only. (using an occpancy scedule)
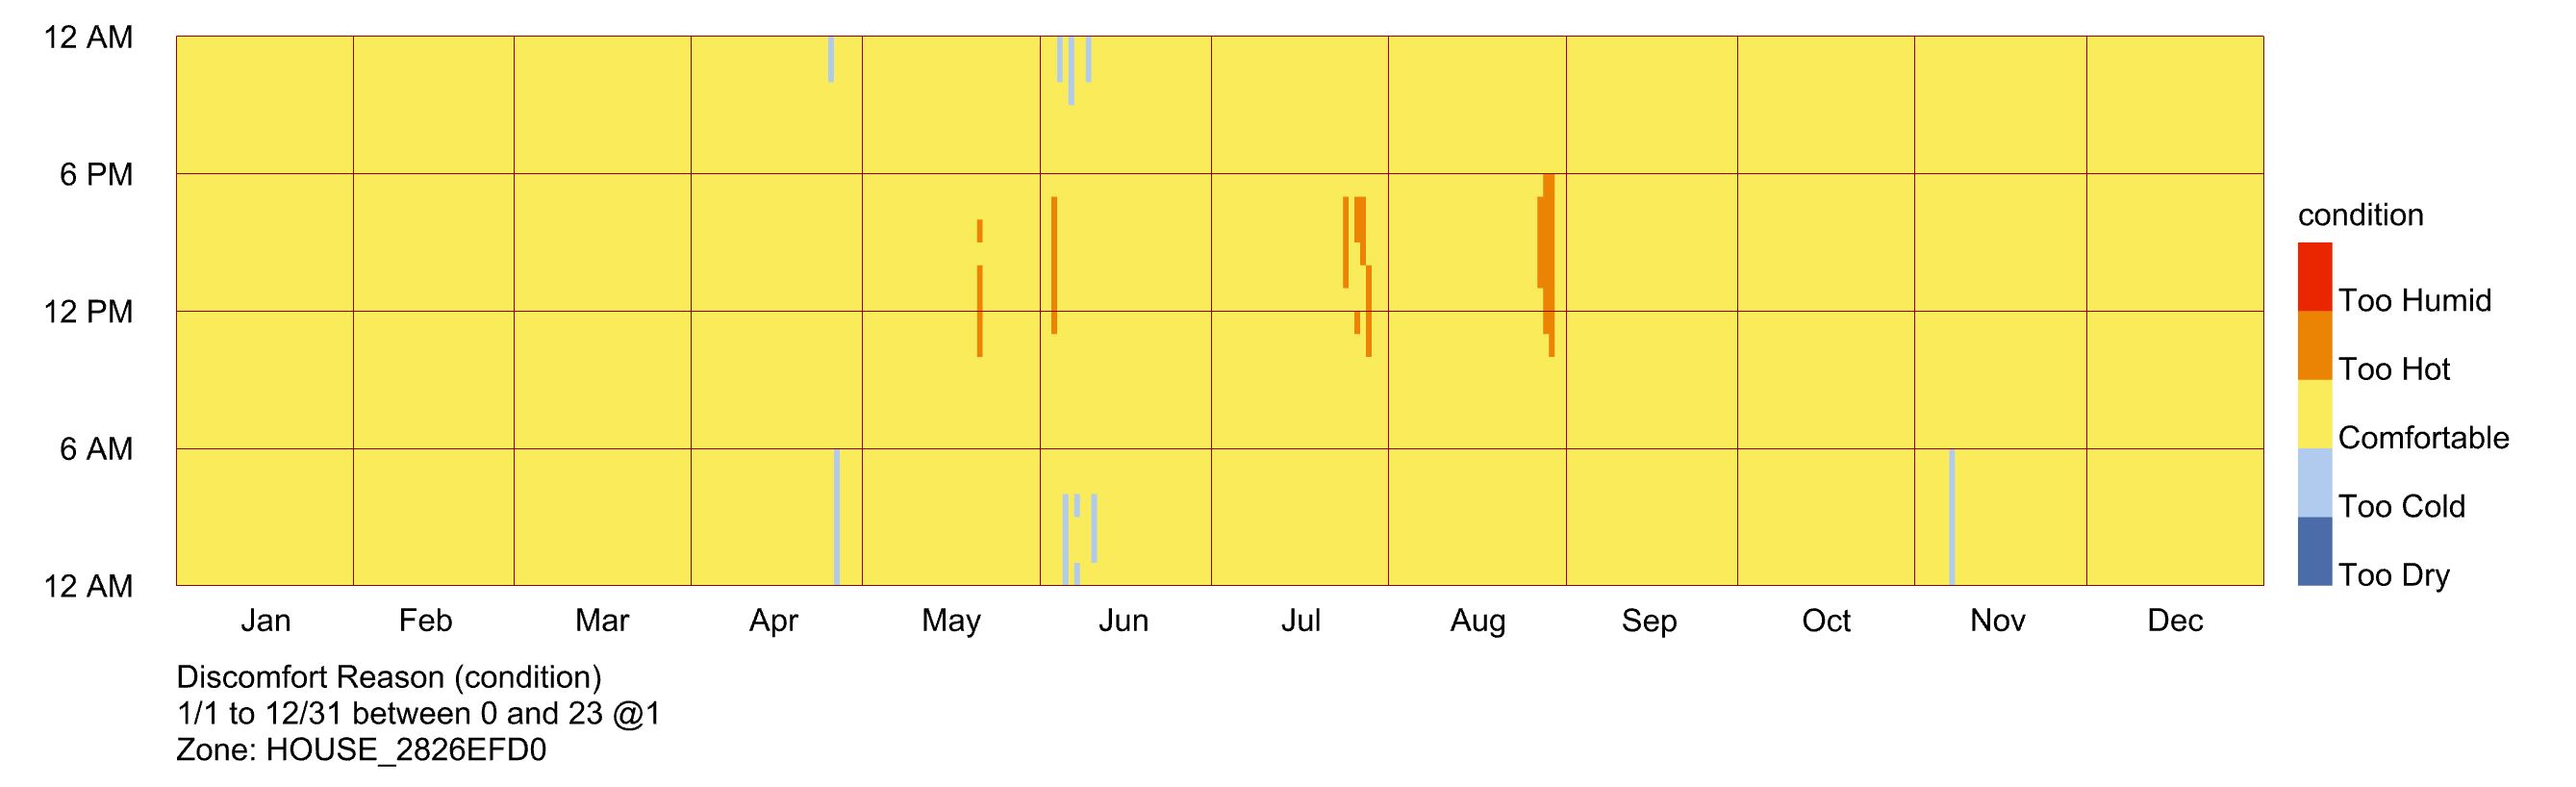
Following up on my previous post, I can confirm that despite trying various approaches with LB PMV COMFORT, I never manage to achieve PMV category II (-0.5 < PMV < +0.5) and PPD < 10%. This is because the indoor comfort swings between being too hot and too cold.
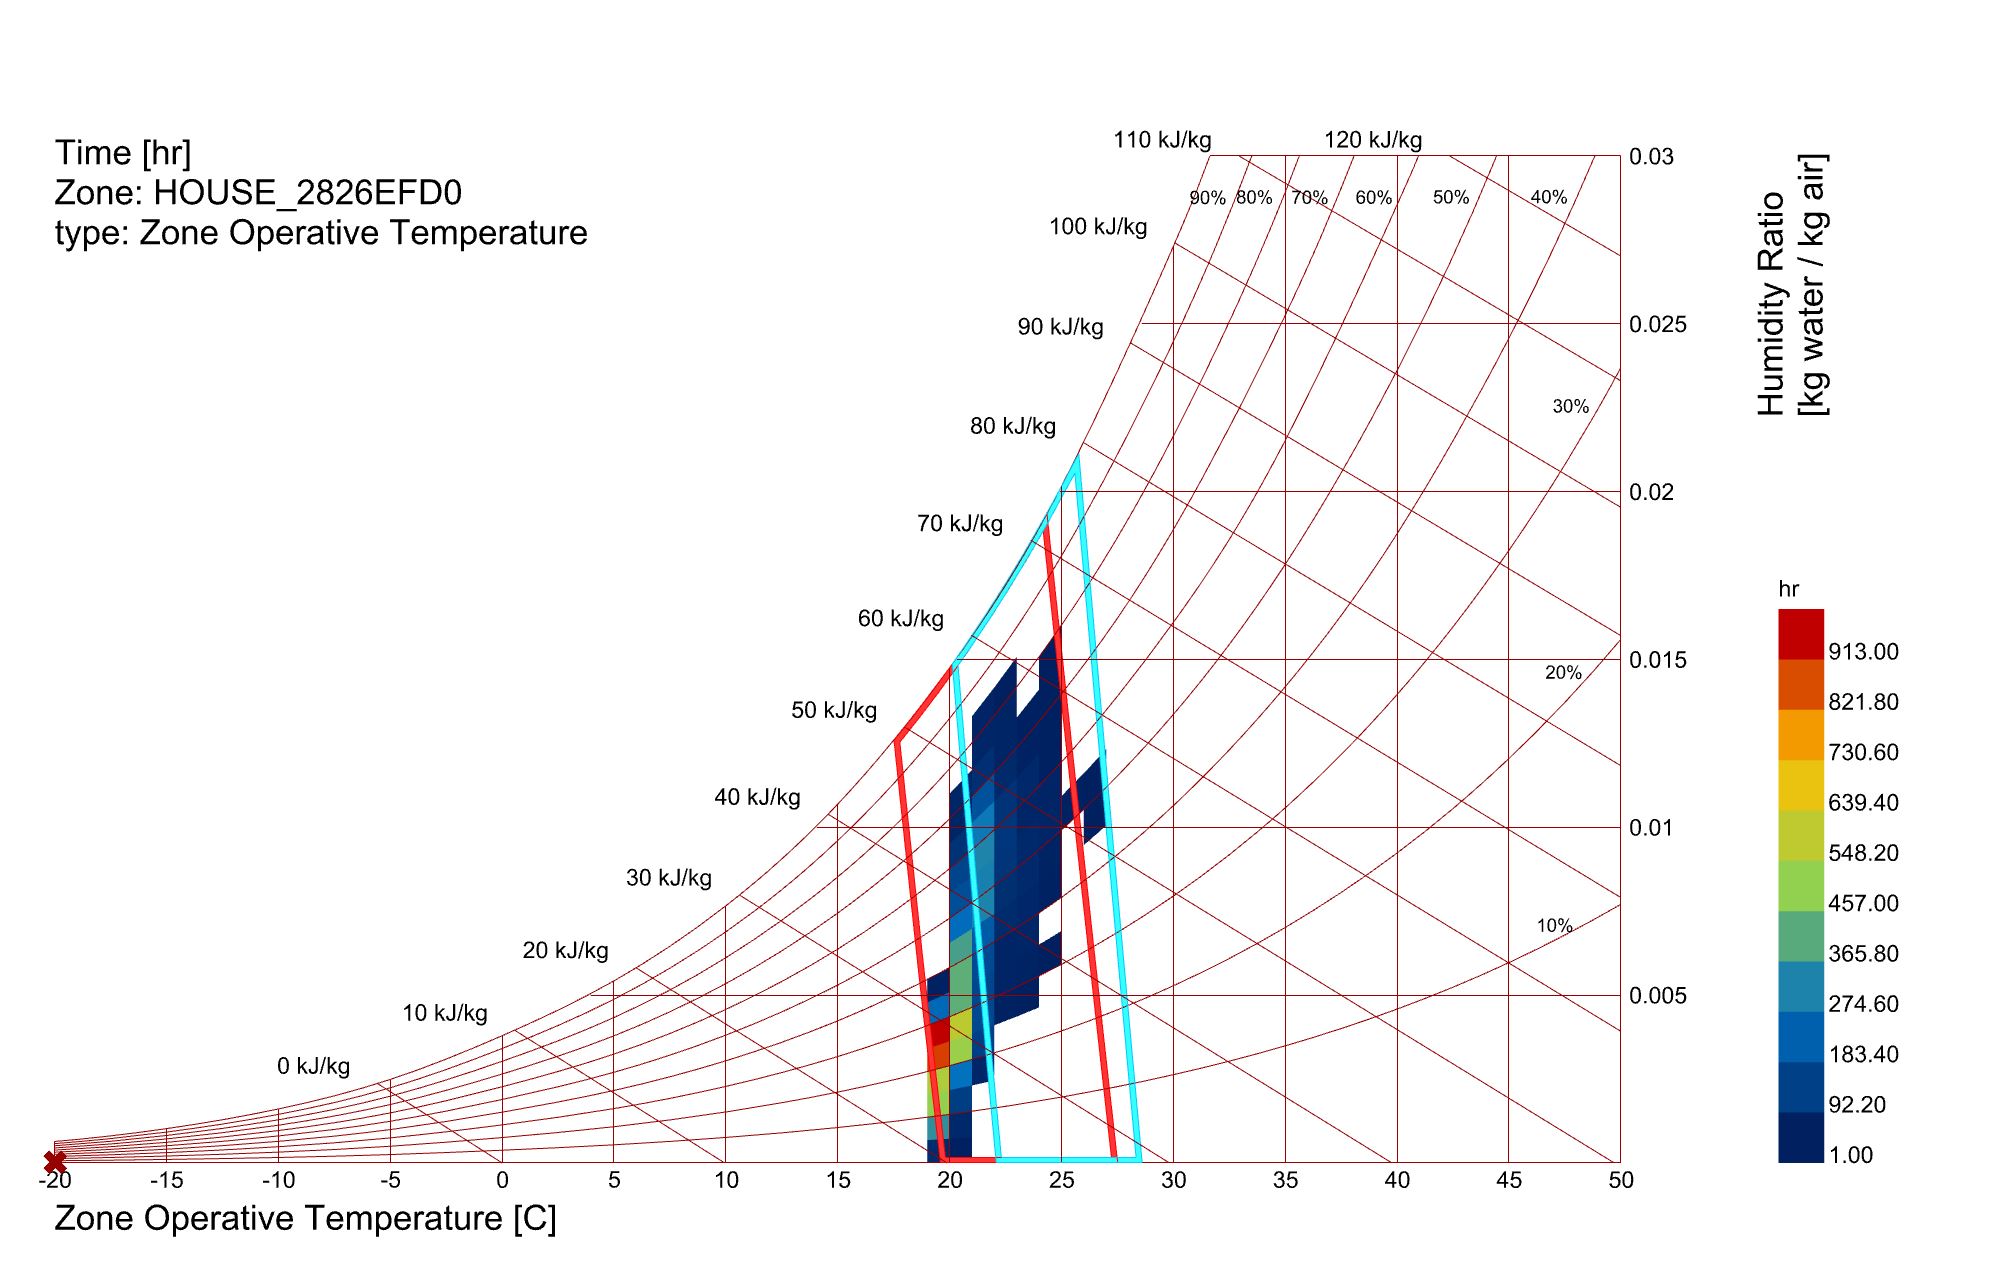
However, when I utilize HB PMV COMFORT MAP, I’m able to attain PMV category II (-0.5 < PMV < +0.5) and PPD < 10%. Though, in this case, indoor comfort tends to be slightly cold.
I’m therefore seeking clarification on the following:
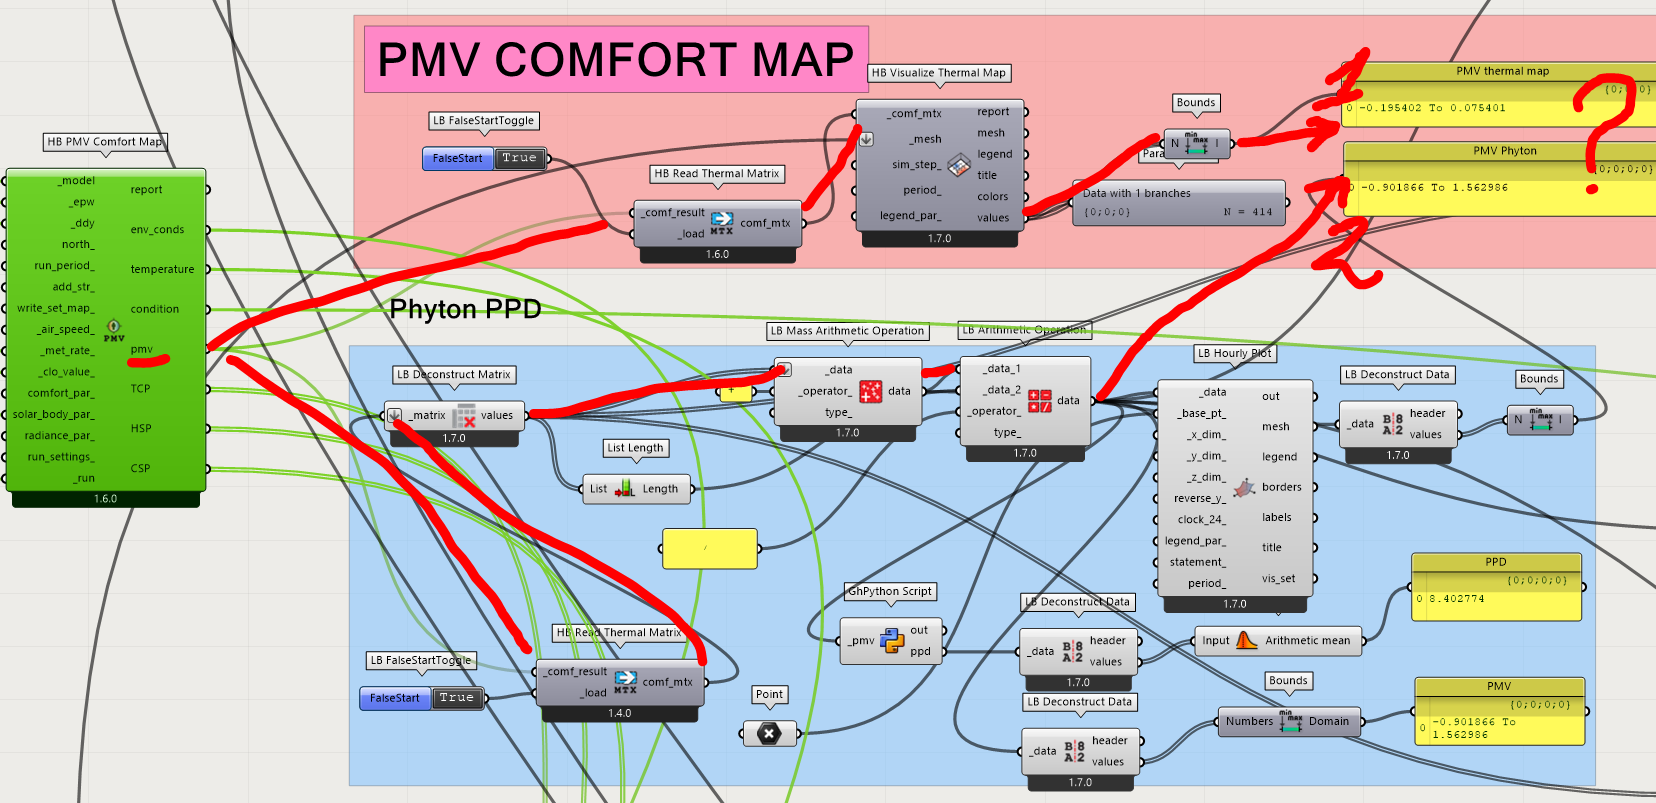
Why do the PMV values from the HB THERMAL MAP component differ from the HB THERMAP MATRIX + LB ARITHMETIC OPERATION?
How can I assess PMV only during occupied hours using a schedule?
What is the purpose of the LB PMV COMFORT component? It is definitely faster then HB THERMAL MAP but can it achieve PMV category II (-0.5 < PMV < +0.5) and PPD < 10% , or is it too inaccurate?
If the LB PMV COMFORT component is deemed inaccurate, when would it be worthwhile to use this component? Conversely, if it is possible, could you provide examples of achieving the comfort requirements outlined in EN-16798?
I appreciate any assistance you can provide in advance.
Sorry for the late response here. Minimal sample files that illustrate how far you have gotten and where you have gotten stuck would be helpful.
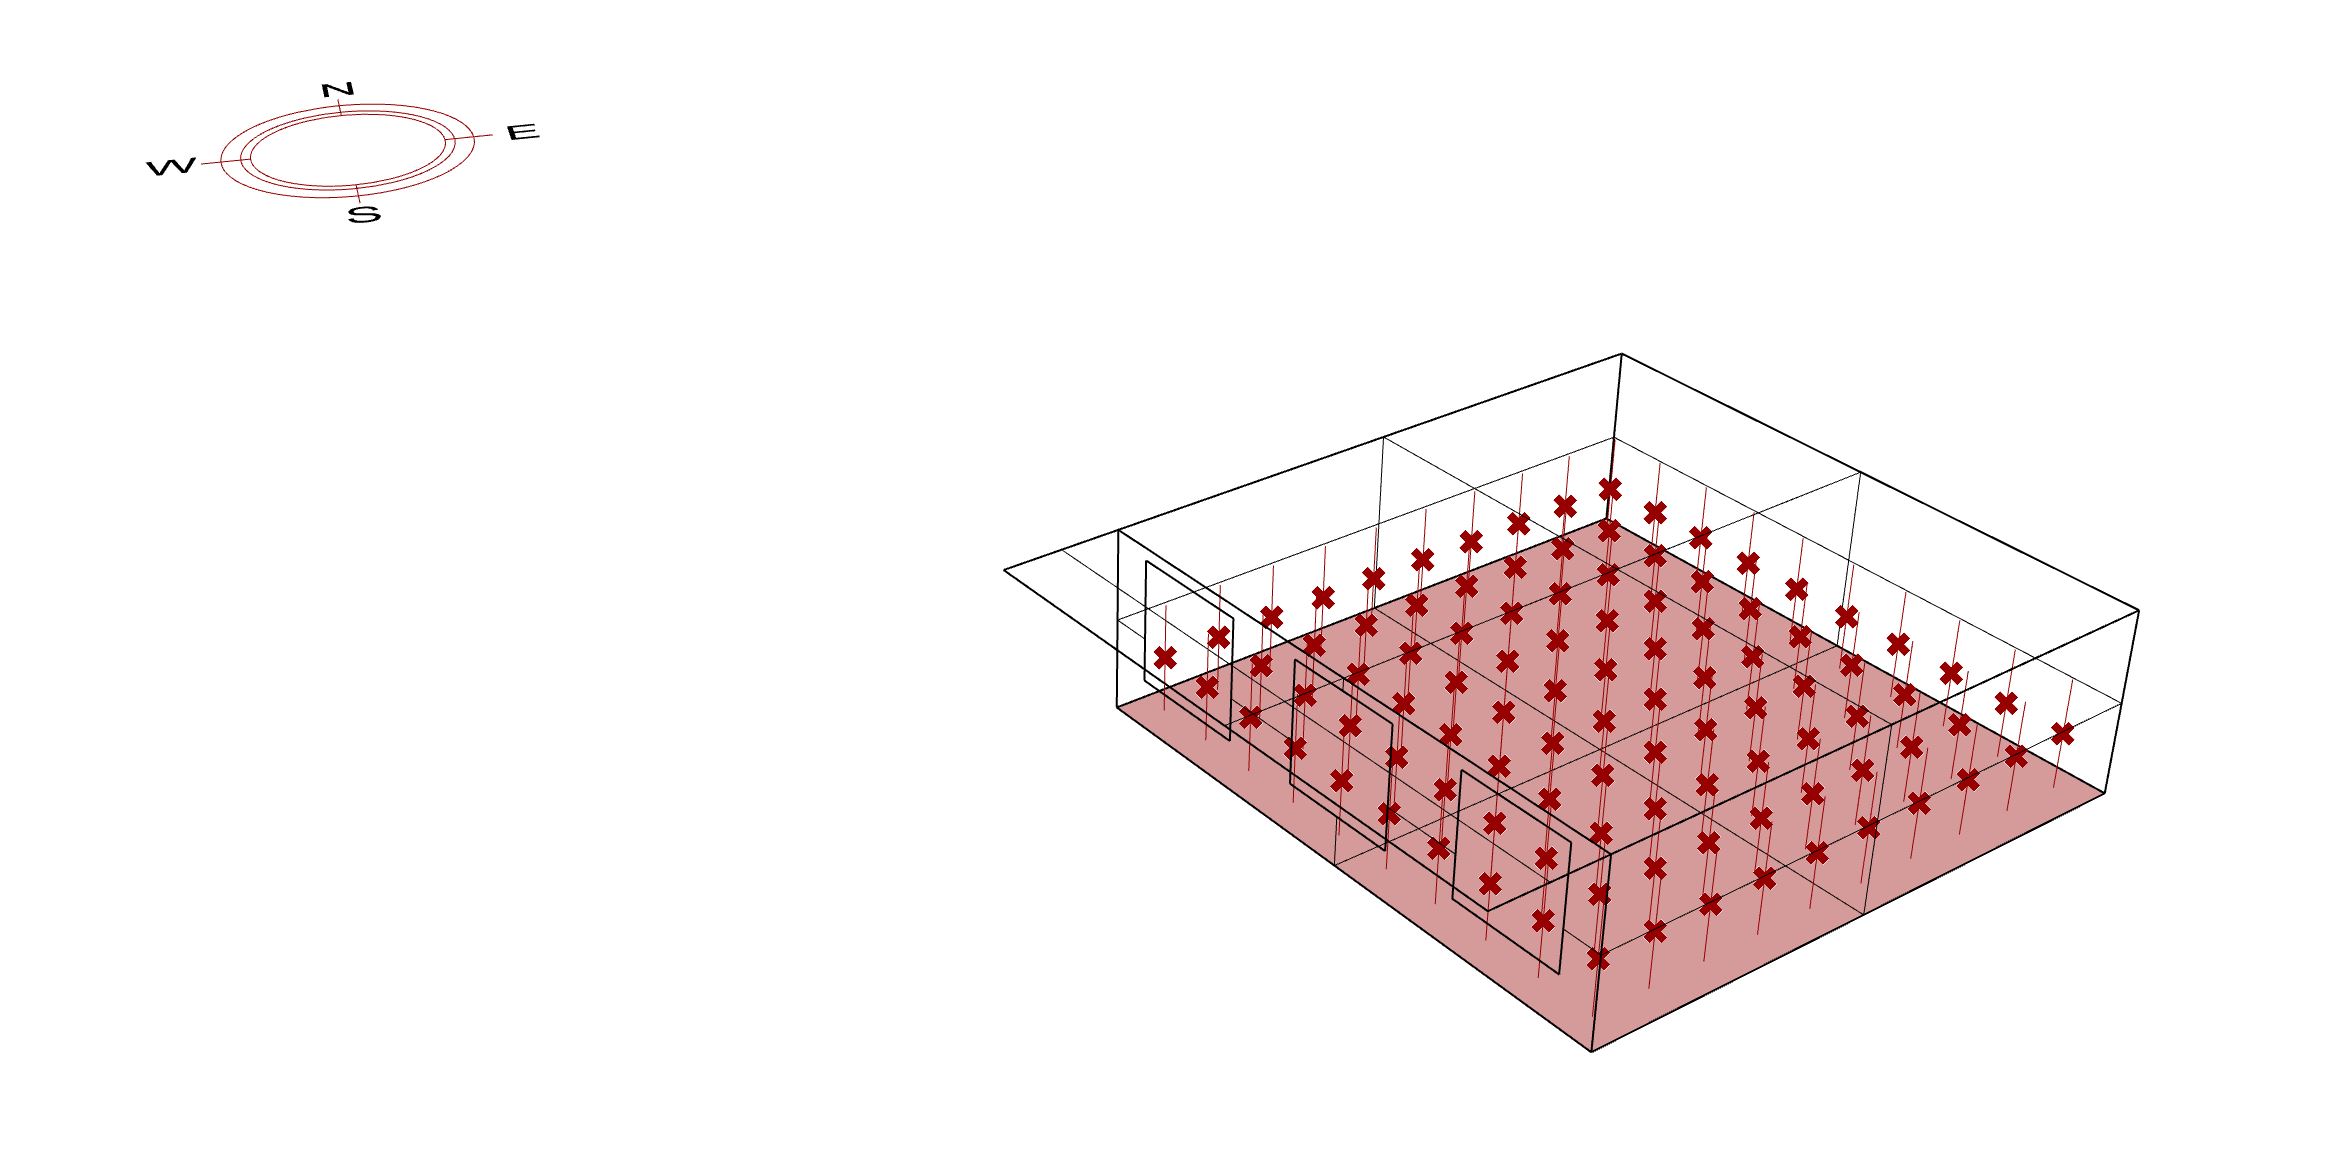
When you run a real energy simulation to evaluate thermal comfort, meeting the PMV standard 100% of the time is challenging, even if you’re just working with the average room air temperature and a room-wide mean radiant temperature as E+ gives you. If you’re including the fact that shortwave solar falls on some parts of the room and makes it uncomfortable (as your screenshots suggest), getting to 100% comfort in these sunny regions is practically impossible. It’s often more practical to just explain to people that this part of the room really isn’t occupiable in a way that is comfortable to occupants all of the time. In other words, your metric of choice becomes “lost usable floor area,” rather than occupant PPD or even “percent of time comfortable.”
This is why I mentioned in the workshop that many engineers typically just take the setpoint they have designed the system so and (wrongly) assume that the air temperature and radiant temperature are the same in order to say that they “comply with ASHRAE-55 or EN-15251.” Truly complying with the standard is challenging because it really requires both the architect and the mechanical engineer to design things well, though historically only one of these parties has held 100% of the responsibility for thermal comfort.
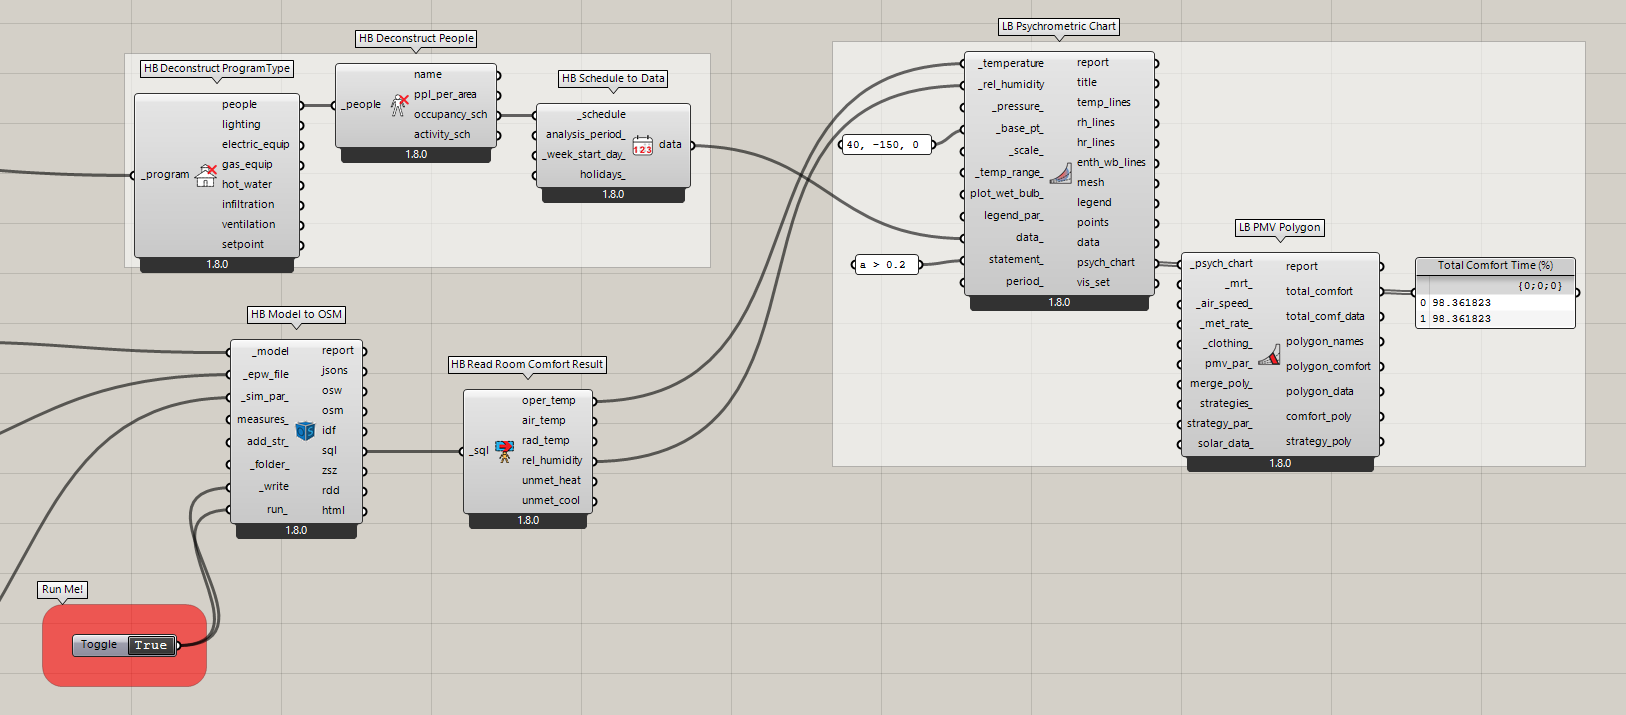
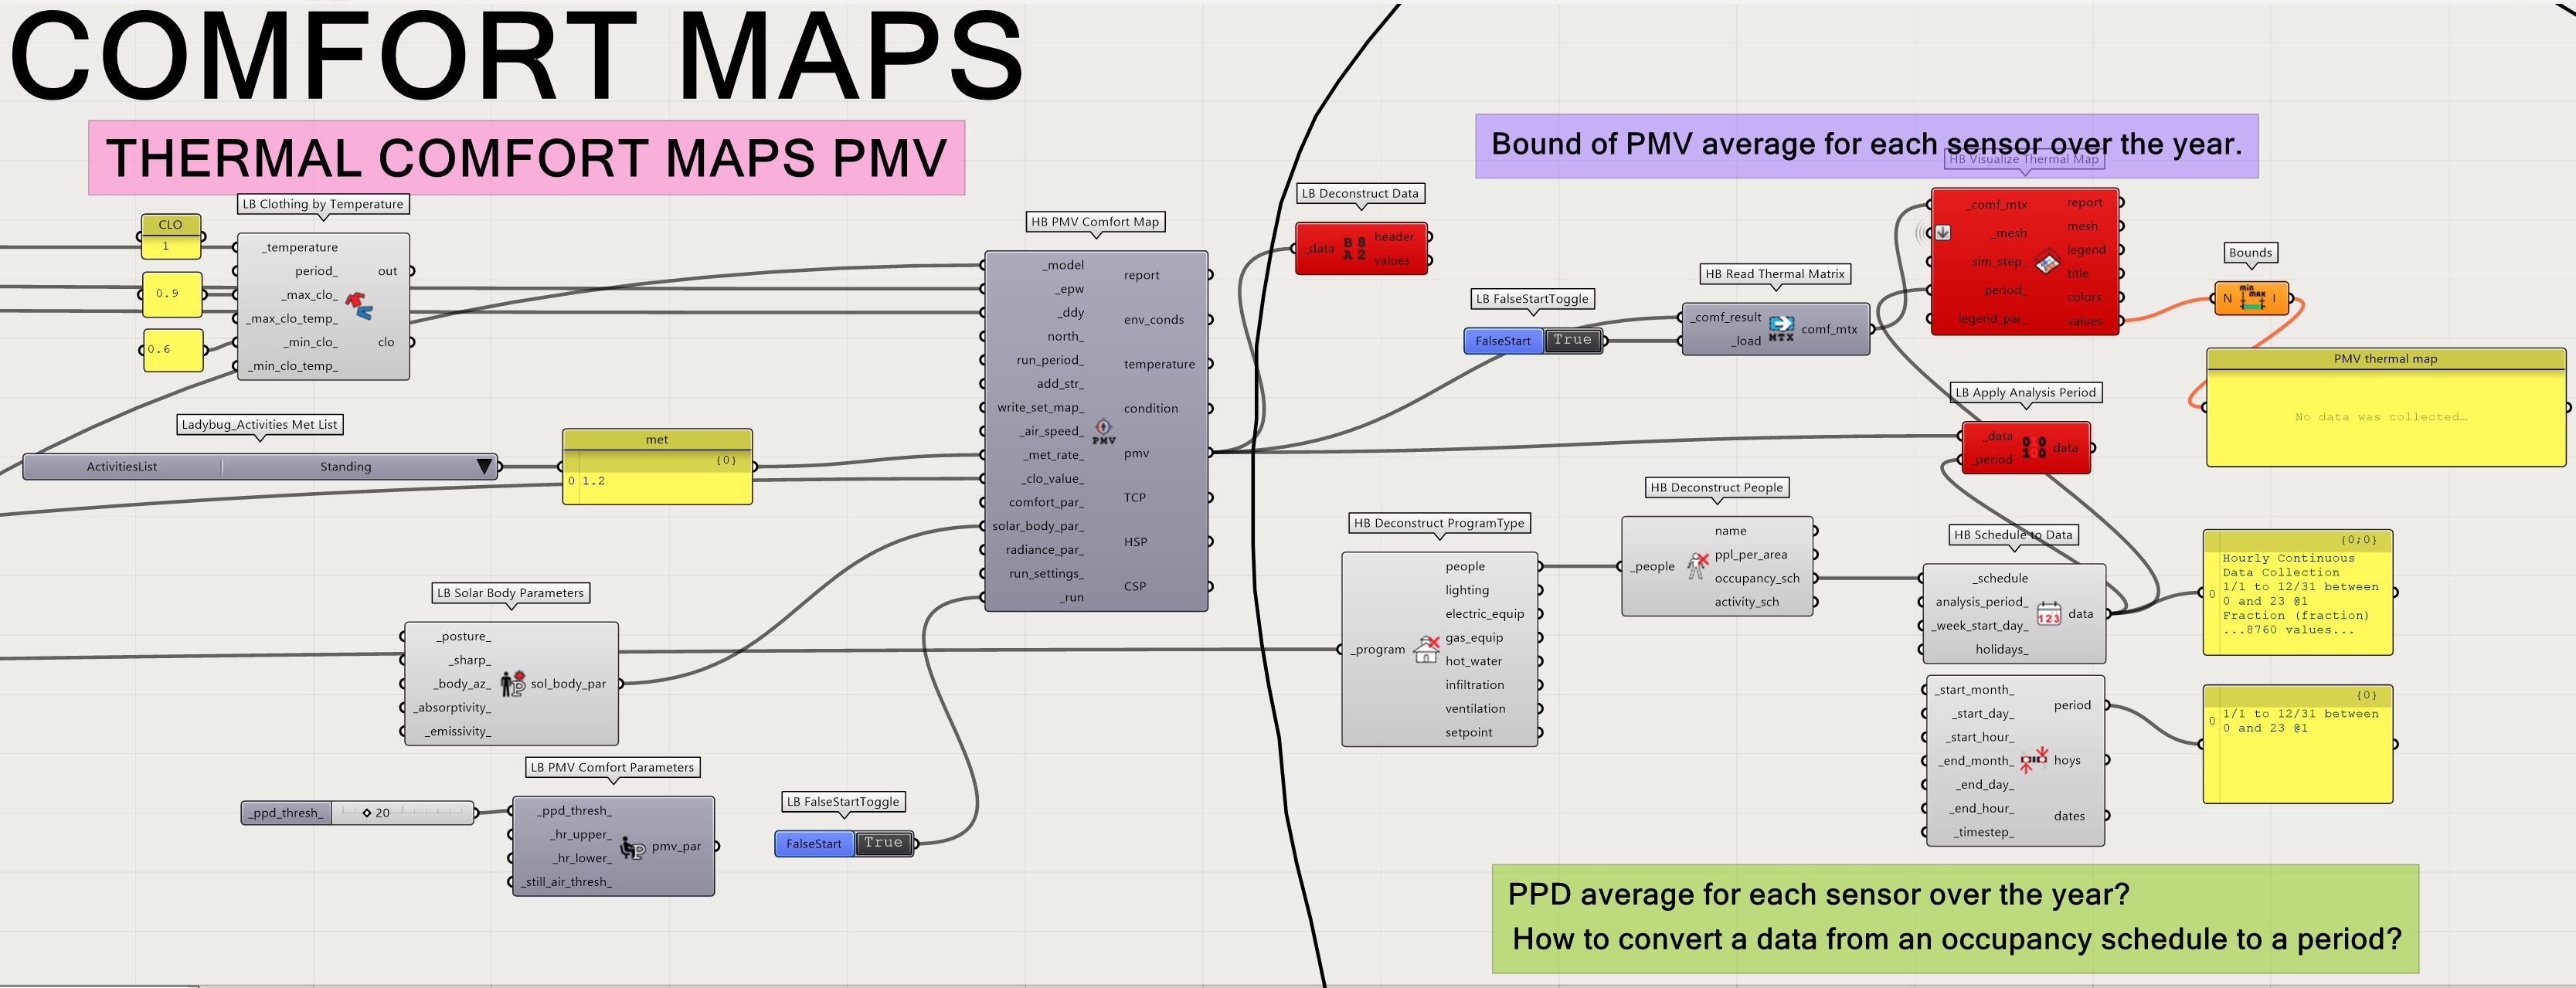
You can see that we plug the occupancy schedule data collection into the psychrometric chart. And a conditional statement is use to select only the hours of the simulation where the occupancy is above 0.2:
You should probably open a separate issue for each of your other questions but looking at the bound of hourly PMV averaged over all of your room sensors is not the same thing as looking at each sensors Average PMV over the whole year. So that’s why you are getting two different ranges for PMV.
Also note that the TCP that you get out of the thermal maps is always computed using the occupancy schedule of the room to determine occupied hours. So there’s a good reason why that’s a good place to start before you start performing your own custom post-processing.
No problem, Chris. I appreciate your responses. I realize now that I should have included a .gh script initially, and I understand the challenges of adhering to standards. Being new to the topic, I’m eager to familiarize myself with the various approaches to achieving thermal comfort.
In Denmark, depending on the type of building, there are normally three methodologies for mechanical ventilated building. Br18 national regulations, DGNB certification, and the DS/EN ISO 7730 standard.
These involve ensuring compliance with room temperature within certain hours
Meeting operative temperature requirements for both summer and winter seasons
Evaluating PMV and PPD.
That’s why I wanted to be able to customize the script to extract PPD data from the HB PMV Comfort Map."
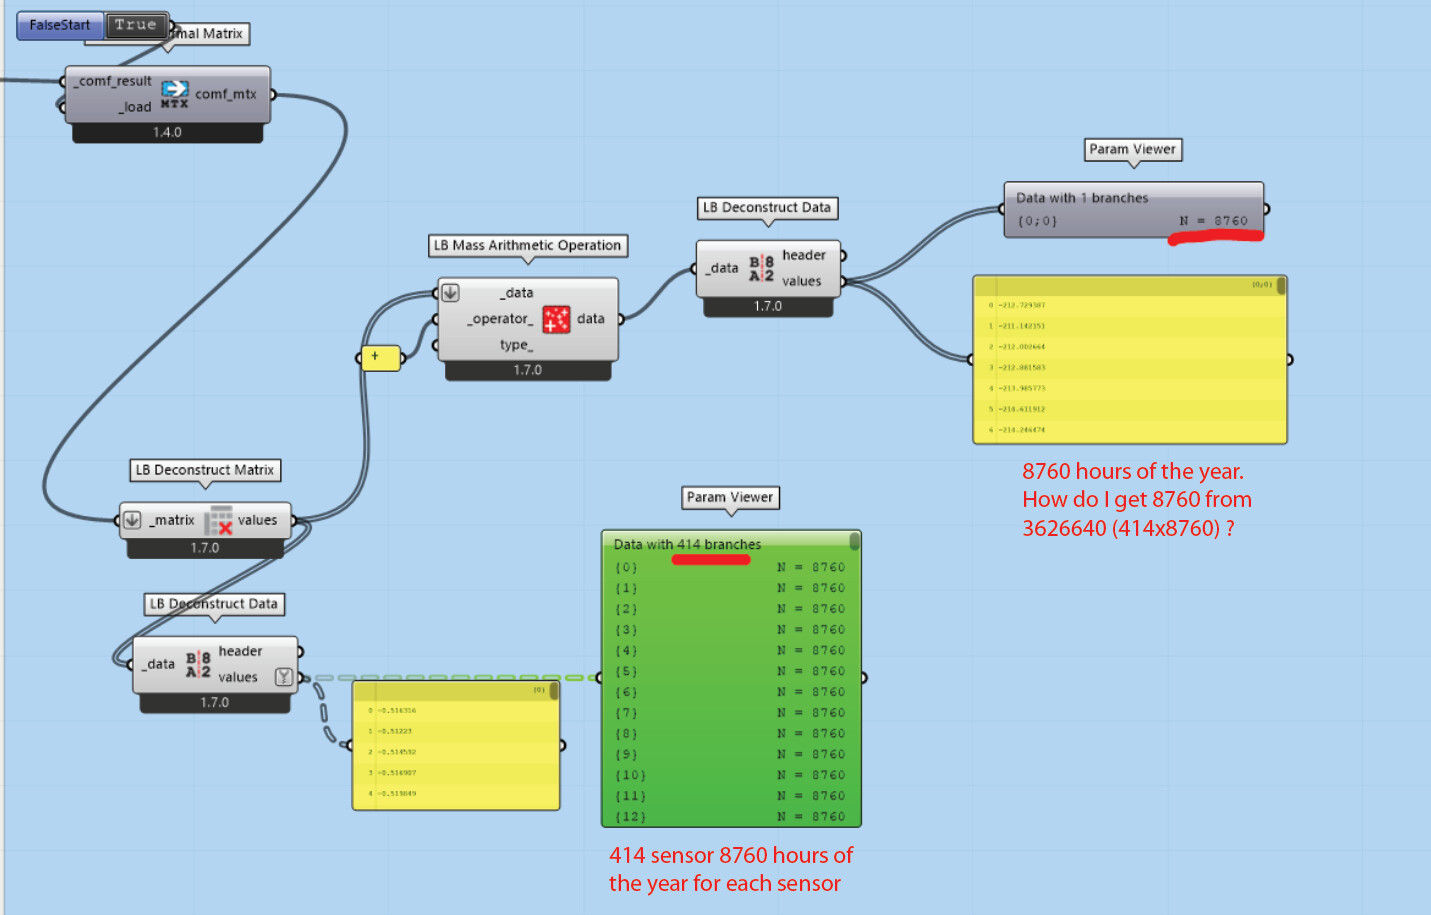
"Absolutely. This time, I’ll keep the discussion here. Apologies, but I’m still a bit confused. If the HB Visualize Thermal map value bound represents an hourly PMV averaged over all room sensors for the entire year, while the Python component provides the average PMV for each sensor over the whole year, how is it possible that the result is only 8760? I’m struggling to understand how I’m getting 8760 from 5475000 (625 sensors multiplied by 8760 hours in a year) using the LB Mass Arithmetic Operation.
My goal is to calculate the average PMV and PPD for all sensors throughout the entire year. Could you assist me with this?"
Enclosed is the working file for your reference. The subject matter discussed pertains to the comfort maps category.
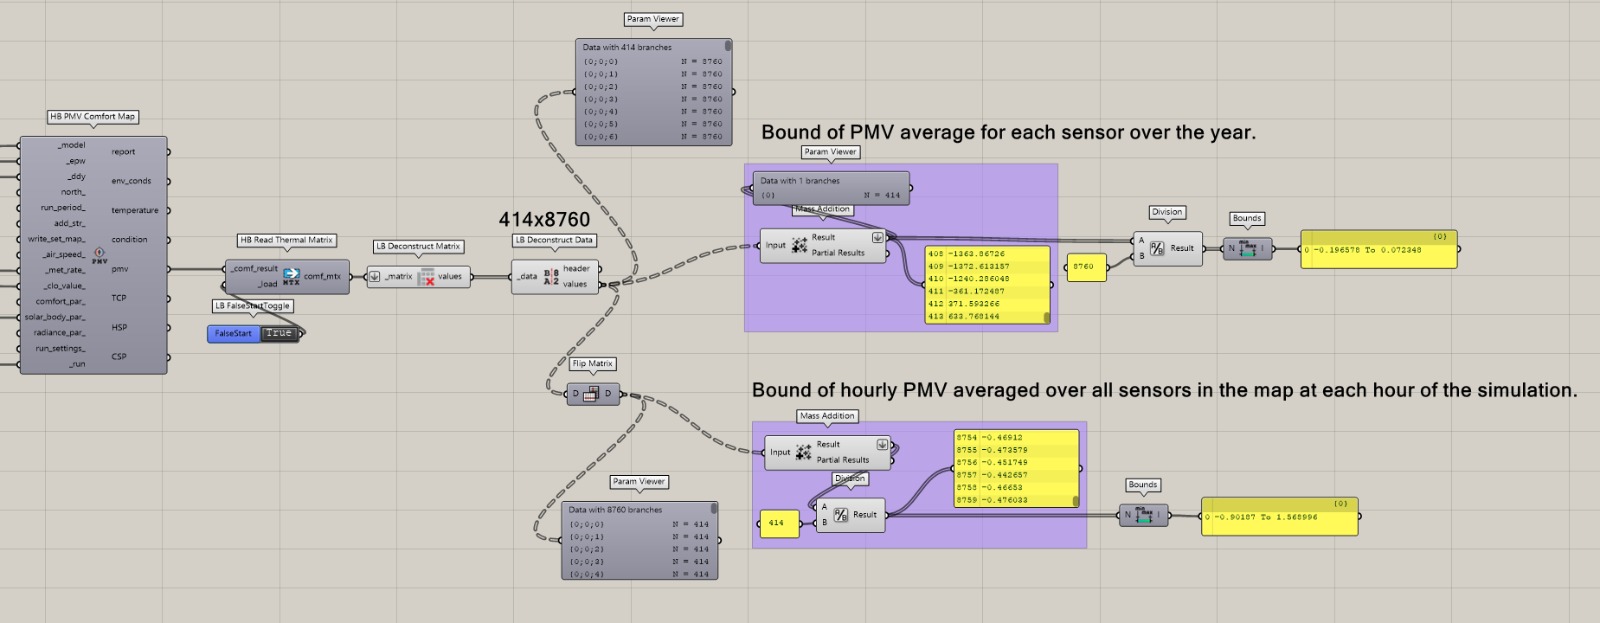
As I said in the previous response, there are two ways to perform this type of “averaging”:
You can take the PMV values over all sensors at each hour, sum them together, then divide by the number of sensors. This gives you the average PMV over all sensors in the map at each hour of the simulation and this is what you are computing with the LB Mass Arithmetic Operation component.
You can take all 8760 values associated with each sensor sum all 8760 values together then divide by 8760. This gives you the average PMV for each sensor over the year and this is what you are computing with the HB Visualize Thermal Map component.
Which one do you want? Or do you want both?
Grasshopper files can be helpful but this is too far from a minimal sample file that clearly shows me what you are asking or even what you want me to look at:
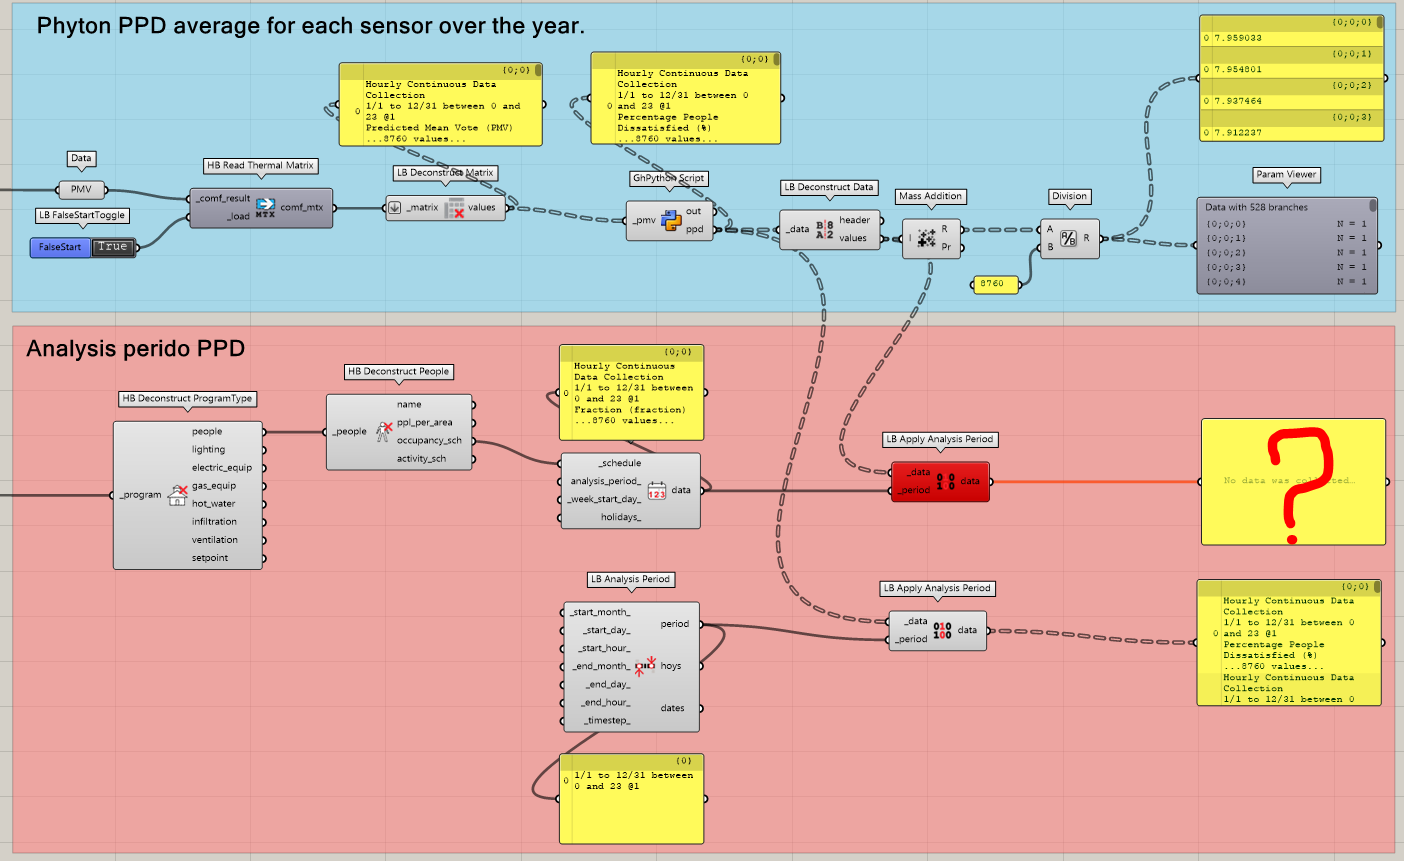
Thank you very much, Chris. I’ve finally grasped the distinction, and I’ve made it visually clear. With your assistance, I’ve successfully obtained the hourly PPD and operative temperature averaged across all sensors in the map for each hour of the simulation.
However, I feel that I’m still missing the PPD averaged for each sensor over the course of the year. Could you assist me with this?
Furthermore how can one transform DATA from an occupancy schedule into a PERIOD?
I understand your point, and I apologize if the script was too dense. I’ve created a copy of the same file where I’ve highlighted only the section related to the comfort maps category. I haven’t deleted the rest to ensure the script remains usable.
I’ve finally completed what I was missing regarding the PPD averaged for each sensor over the course of the year. Could you consider integrating the PPD into the next release of the HB Visualize Thermal Map component?
What I’m still struggling with is how to convert data into a period in order to run the analysis only during occupied hours. As you suggested, I’ve created a specific topic for this.
I’m looking forward to receiving some input on this matter.
I’ll keep the idea of an official PMV > PPD component in the back of my mind but I generally use the “rule of three” to decide if something should be a new official component. That is, a different person needs to ask for it 3 times or I need to find myself in 3 situations of having to make the component again in GHPython.
Right now, you are the only person who has asked for this type of component and my guess is that, if there are others who have found themselves in a similar situation, they know enough about coding with our SDK to make their own component.
Thank you for your response and for considering the idea of an official PMV > PPD component. I understand and appreciate your “rule of three” approach. I wanted to mention that the post received 482 views, which suggests a significant interest in this topic within the community, likely due to the reliance on the PPD method in many certification systems.
In the meantime, I’ll utilize the current tools available and make the necessary adjustments using GHPython as needed.