Dearest Ladybug Tools Community,
We are happy to announce another stable release of Ladybug Tools (LBT) for Grasshopper (version 1.2.0)!
You can download it from Food4Rhino and install by following the instructions here.
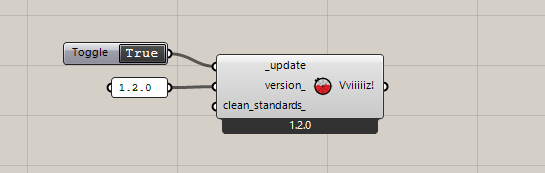
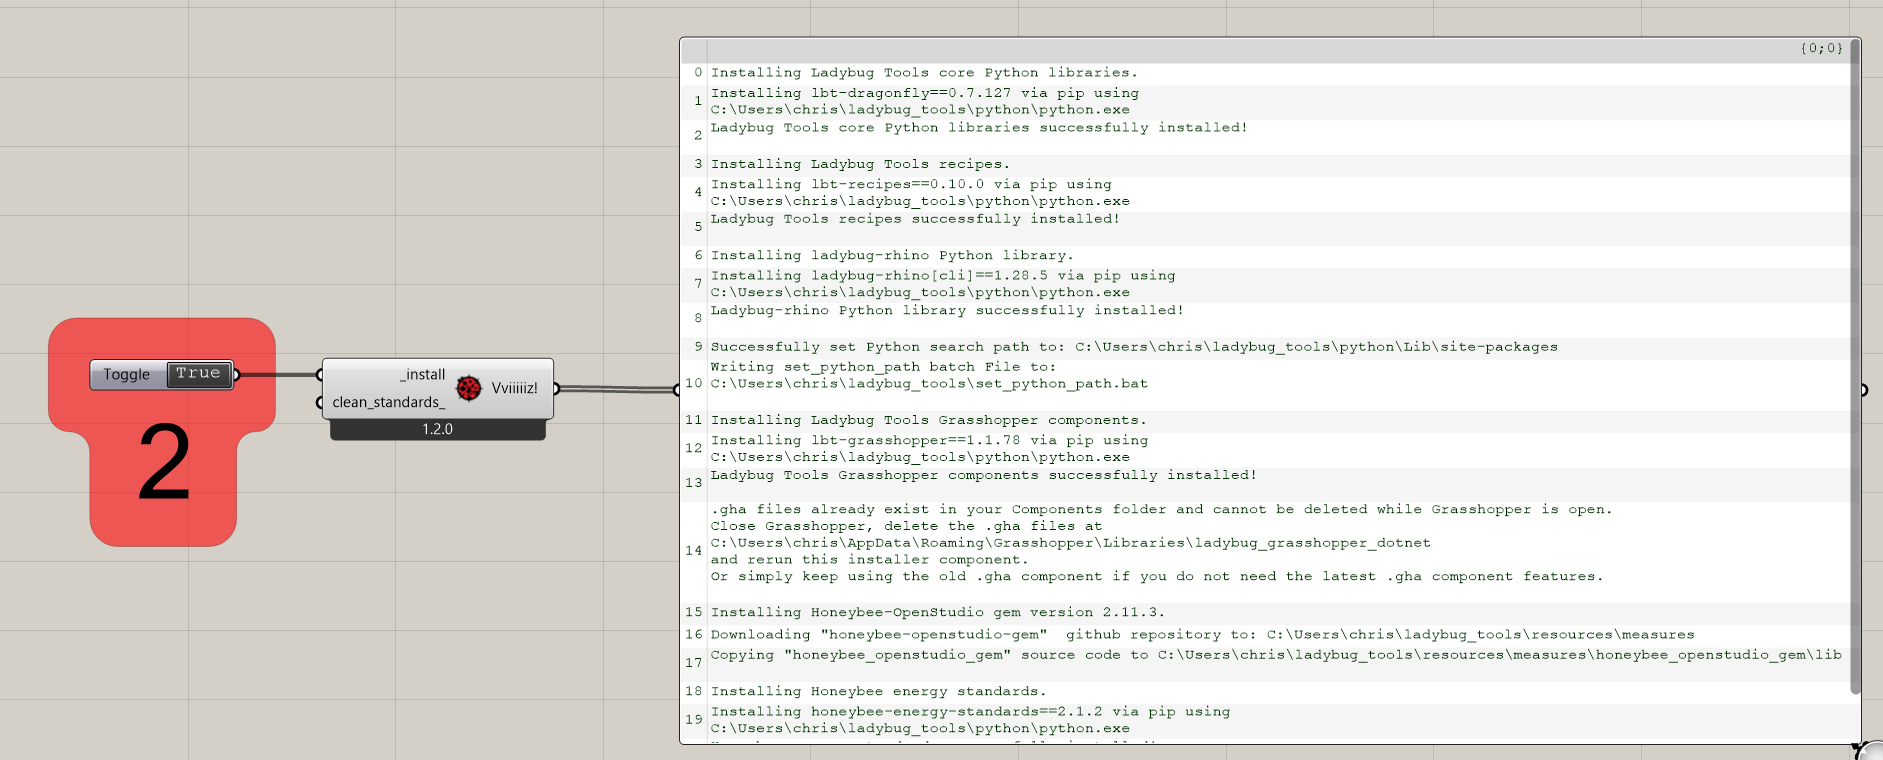
For people who already have the LBT 1.1.0 plugin installed, you can upgrade to version 1.2.0 just by updating your simulation engines to those in the compatibility matrix and running the second component in the installer.gh:
Remember that you also need to run the “LB Sync Grasshopper File” component with any of your old Grasshopper definitions (created with version 1.1) in order to sync the components on the canvass with the new ones in your toolbar.
Alternatively, if you prefer to “wipe the slate clean” and do a fresh installation, this uninstaller.gh can be used to remove all traces of Ladybug Tools from your system.
Since version 1.1.0, we have made a lot of progress in terms of adding missing Legacy plugin features. There are still a number of features left to add but we are close and we have been prioritizing capabilities based on the feedback we get on this forum. So we thank everyone who has given us feedback and, particularly for the members of this forum who teach the Ladybug Tools, we hope that the current release will allow you to convert your course materials over to the new plugin. Since the last release, we have also fixed a lot of edge-case bugs thanks in large part to the reports of community members here on the forum. So a big thanks goes out to everyone who reported issues.
Now, on to the exciting part!
Ladybug Features
Psychrometric Chart and PMV Comfort Polygon
We knew that this was a priority for many of you and we are happy to say that the Psychrometric Chart has made it into version 1.2.0! Effectively all of the legacy psych chart features are supported, though the component has been split in two such that the plotting of the PMV + strategy polygons happens with a separate component from the drawing of the psychrometric chart.
Click to read more
In addition to the standard improvements of LBT graphics (eg. editable text objects, improved performance), we exposed a few new options, like the ability to set the lower and upper boundaries of the chart. We have (almost all) of the passive strategy polygons implemented in a way that is robust across different versions of Rhino and different chart dimensions,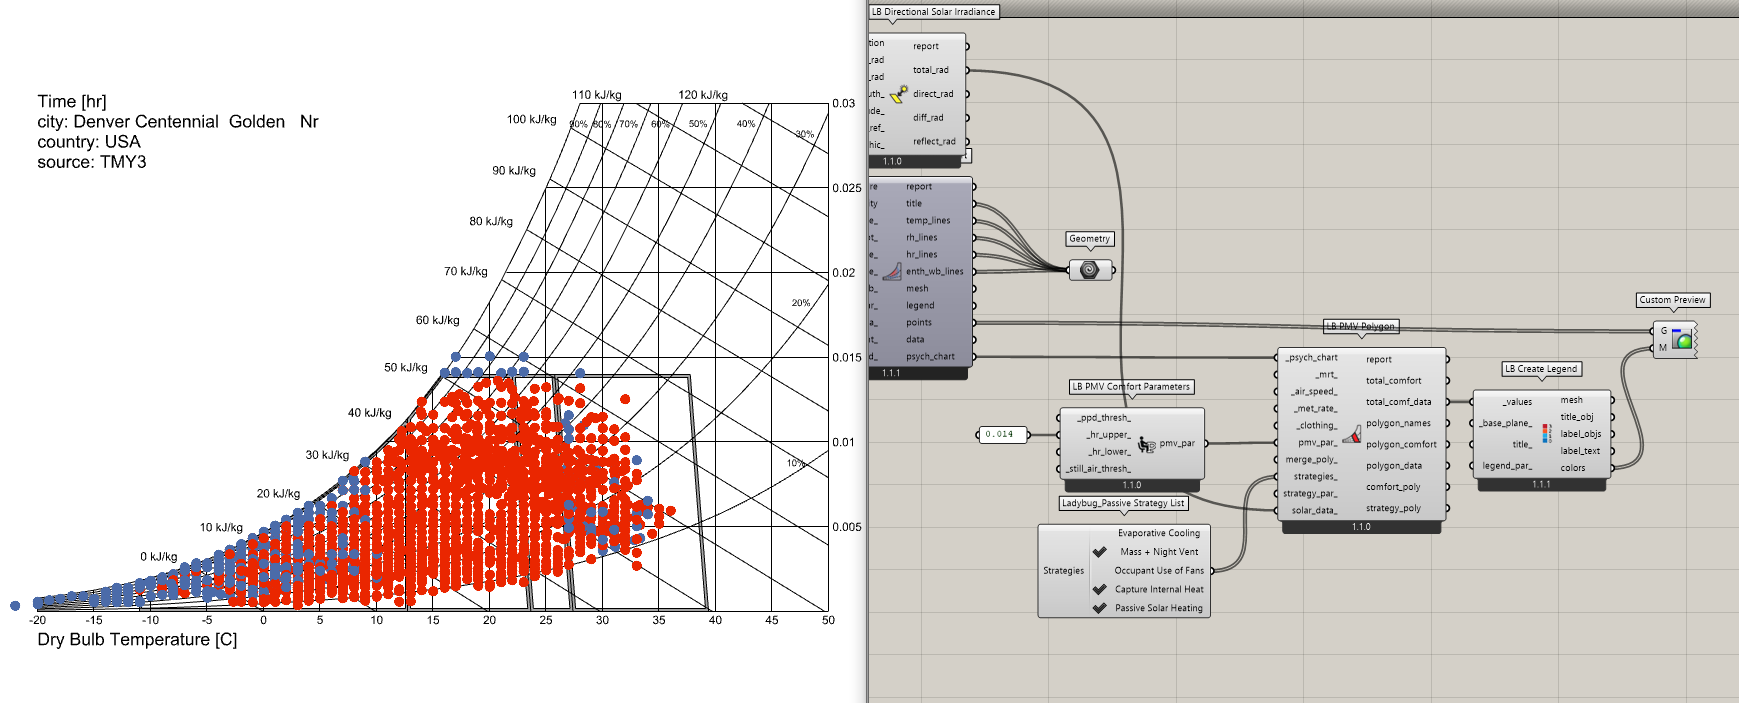

Sky Mask and Solar Envelope
Many of you told us that these two components were another high priority and we are happy to say that they are in LBT 1.2.0 with effectively all of their Legacy features.

More Data Converters
After several cases of using native Grasshopper components to convert the units of data collections, we finally added components to streamline the process. Notably, we added a component that lets you normalize any data collection by an area (LB ARea Normalize), converting units like kWh into kWh/m2. You can also easily convert rate-of-change metrics like W and m3/s to time-aggregated values (kWh and m3) and vice versa.
Honeybee Energy Features
Service Hot Water
A simple search through our forum will show that modeling hot water usage has been one of the biggest requests over the past few years. This is not just because it’s an important factor of building energy use but because it can also have an influence on the thermal balance of an energy model’s rooms (albeit a small one for most programs). For these reasons, we are happy to say that version 1.2.0 supports the assignment of hot water loads and you can now get hot water energy usage out of honeybee energy simulation.
Click to read more
Furthermore, the library of program types that ship with Honeybee has been updated to include default values for hot water usage of each room program. These water usage defaults have always been in the DoE commercial reference buildings and the [OpenStudio standards gem](https://github.com/NREL/openstudio-standards) (where the program templates are pulled from). So their inclusion within Honeybee means many simulations will be just a little more accurate.Annual Loads
The “HB Annual Loads” component was in the last release but we wanted to highlight it here because we added several improvements that make it particularly useful for checking the assumptions assigned to energy models and for teaching people about these assumptions. At its core, the component executes a fast EnergyPlus simulation that is optimized for getting monthly heating, cooling, and internal loads.
Click to read more
Because the component assumes that you are not running a simulation to get advanced outputs like HVAC electricity use or thermal comfort, the simulation can be run much faster than normal, with a shoe box taking ~1 second. This means that you can scroll through sliders of properties in real-time to see the impact on heating and cooling. For this release, we also added an option to output the monthly load balance so that you can quickly understand what is driving the heating/cooling loads of any honeybee energy model.
Peak Loads
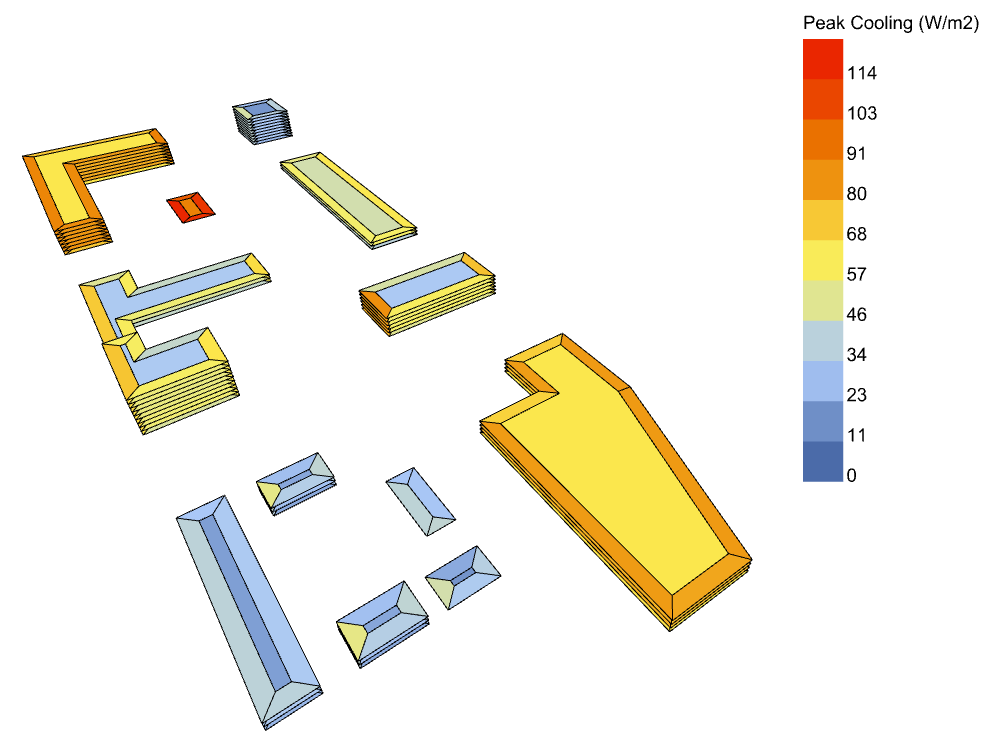
The “HB Peak Loads” component follows a similar structure to the Annual Loads in that it runs a very fast, optimized EnergyPlus simulation. However, in this case, the output is the sensible peak cooling and heating loads on the summer and winter design days. These peak loads not only play an important role in determining the size and cost of heating/cooling equipment but they also tend to constrain how energy-efficient an HVAC can be used for a particular space. So we hope that many of you will use the new component to make strong cases for cost-effective, low-energy HVAC systems.
Click to read more
In addition to outputting the demand profile (above), the component also outputs the peaks for individual rooms, enabling you to make spatial visualizations like the following:
EUI Component
After several cases of waiting (sometimes over a minute) to parse energy use data of large models only to reduce all of this data to a single EUI value, we finally added a component that is dedicated to quickly importing EUI. The component is called “HB End Use Intensity” and you can find it under the HB-Energy Simulate tab.
Click to read more
Because it only imports the aggregated energy use and floor area, it is far faster than importing hourly or even monthly data. You can even use it to compute the combined EUI across several EnergyPlus sql files.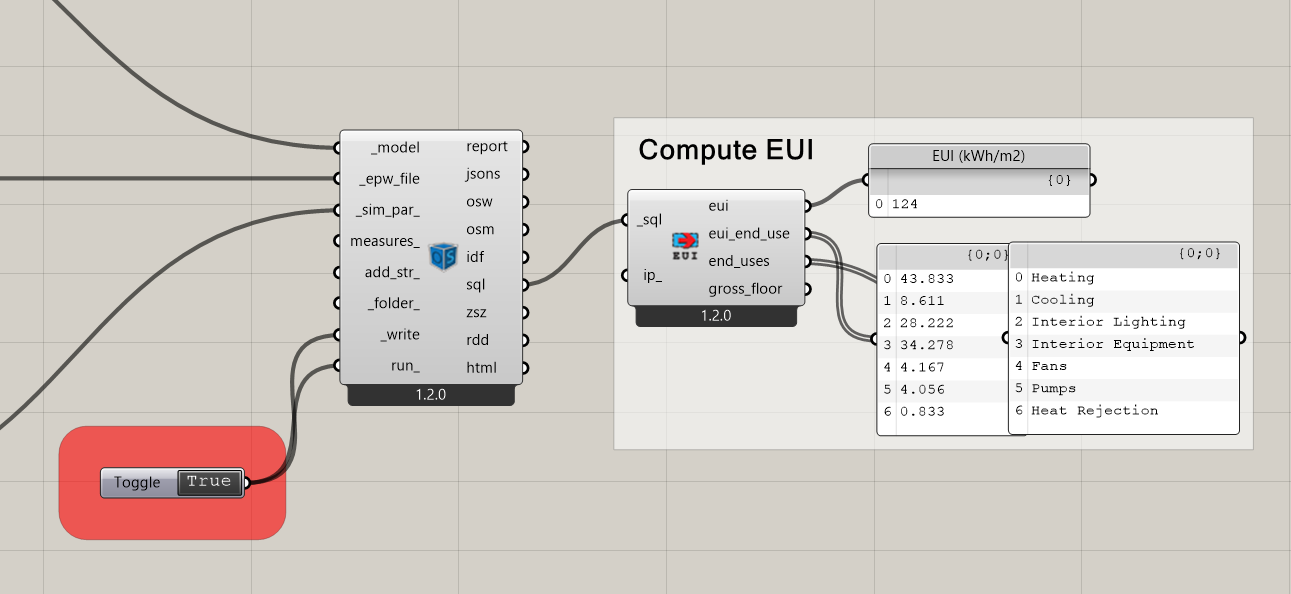
First Draft of Thermal Mapping Recipes
As promised in the last release, we have been working towards migrating and improving the thermal mapping capabilities to the LBT plugin. We have a “first draft” of the components available in version 1.2.0. The component inputs have been streamlined such that the only required inputs are now a Honeybee Model and weather data. Furthermore, the components output values of Thermal Comfort Percent (TCP) or the percentage of occupied hours that meet a comfort standard:
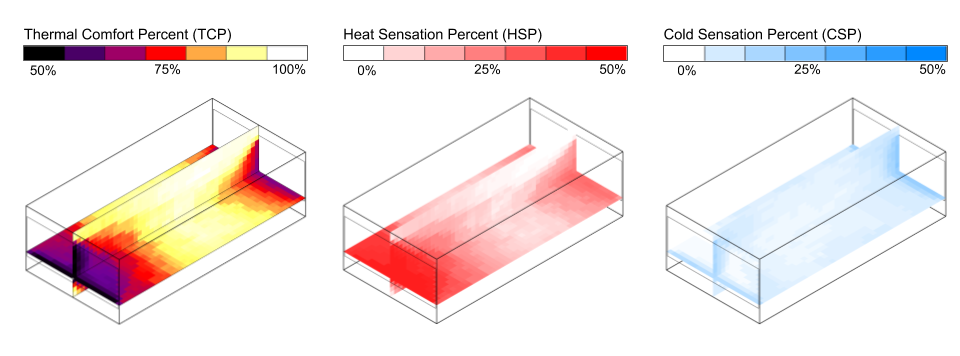
Click to read more
The shortwave calculation of the new recipes is a huge improvement over Legacy in that we now use Radiance to compute the amount of shortwave solar energy that falls onto each sensor point. This allows us to account for shortwave reflections across the model (legacy only accounted for the ground reflected shortwave). It also means that we better-account for the sun position in the direct-sun calculation. However, at the moment, the longwave calculation is not as good as legacy and this is only because we haven’t yet implemented the computation of view factors between sensor points and surfaces. We should be able to get this done for the next stable release but just bear in mind that, currently, the longwave MRT is just the zone-average MRT for all points in a given room. Or, if the points are outdoor, the longwave MRT is that of a person standing in an open field.Honeybee Radiance Features
Restructured Recipes
The thermal mapping recipes aren’t the only recipe components that have gotten a makeover. The Honeybee-Radiance components now output results directly from the recipe component, saving the need for additional post-processing. The change not only means that your Grasshopper definitions can get a bit simpler but it also results in performance improvements by virtue of the fact that data doesn’t have to be loaded into Grasshopper in order to post process it.

New Recipes for Radiation and Direct Sun Hours
While we are aware that there are still many Radiance recipes left to implement, we are happy to say that there are two new ones in version 1.2.0. Specifically, there is now a “HB Annual Radiation” recipe, which runs similarly to the Annual Daylight recipe but will irradiance instead of illuminance. There is also a “Direct Sun Hours” recipe, which runs similarly to the “LB Direct Sun Hours” except, because it uses Radiance, the size of the calculation can scale much better for large models than the Ladybug component can.
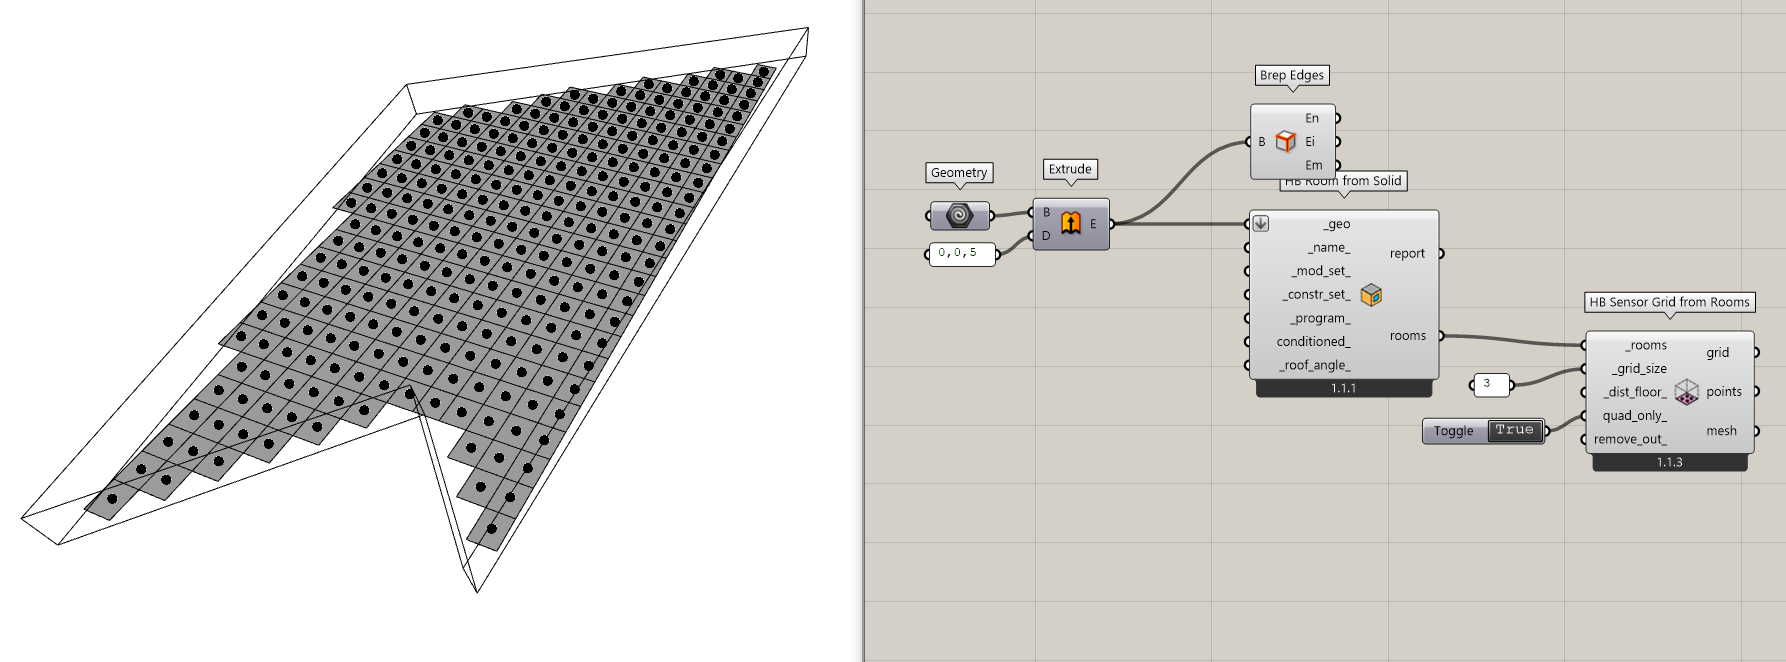
Quad-Only Grid Option
Because several types of daylight compliance calculations require sensor grid cells to be of a consistent size, we have added a quad_only_ option to all of the components that produce sensor grids and corresponding meshes. The method is effectively the same as what is in this thesis document and it ensures that all mesh cells occupy the same area.
Dragonfly Features
More Visualization Components
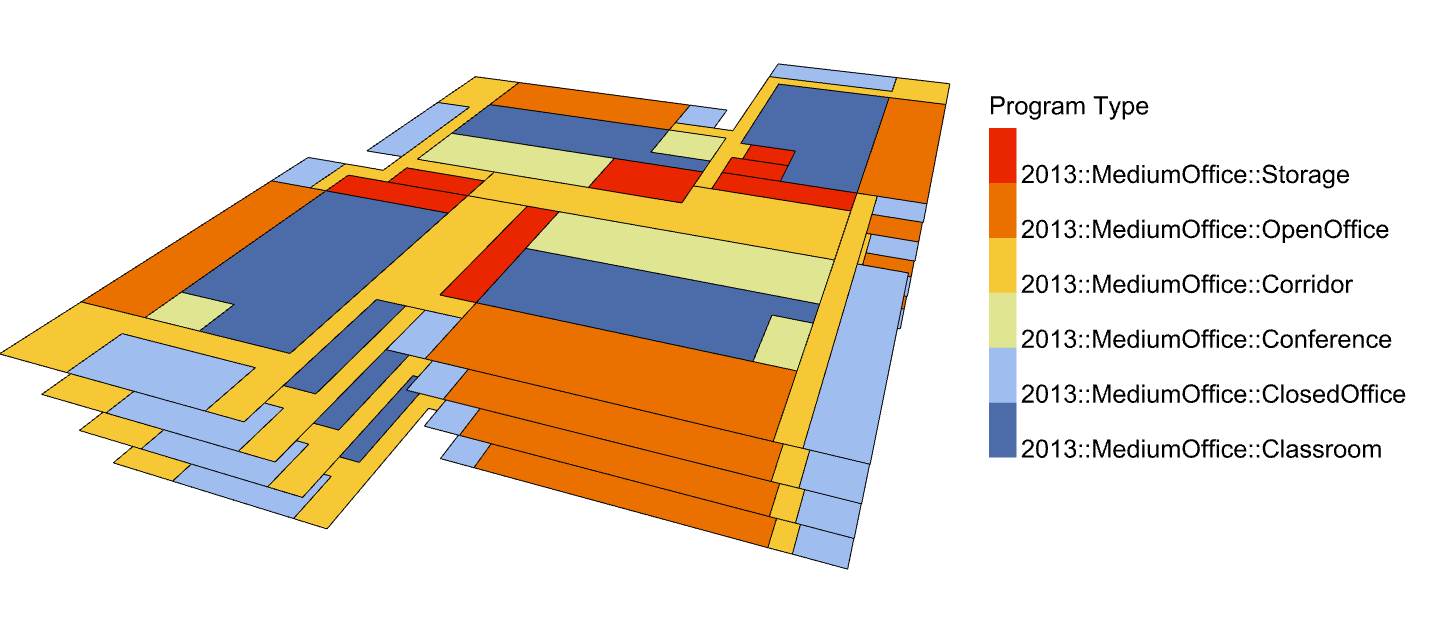
The Dragonfly “Visualize” tab has gotten a few new components with this release that should save you from having to translate the Dragonfly model to Honeybee just to check the model assumptions. Notable among these is a “DF Color Room2D Attributes” component that can produce visuals like the following:
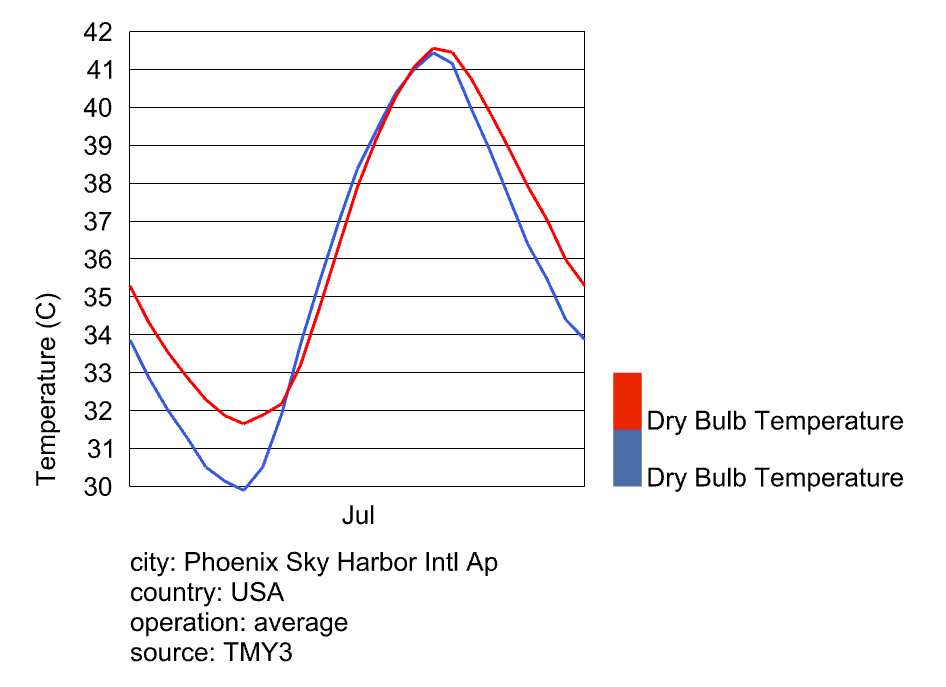
Urban Weather Generator Connection
As we said in the release notes of version 1.0, we have been working towards integrating the Urban Weather Generator (UWG) connection into LBT Dragonfly. We are happy to say that the connection is complete and you can now run any Dragonfly model through the UWG to morph rural/airport EPWs to account for the Urban Heat Island effect in the street canyon.
REopt and OpenDSS Connection
As part of the connection to the URBANopt SDK for the simulation of district-scale energy models, we are happy to announce that dragonfly-generated energy results can now be used as input for two further types of analyses related to district electrification and grid-planning. The first is the REopt Lite application, which can perform life cycle cost-optimization of photovoltaics and other renewable energy technologies. There is a dedicated Dragonfly component for sending URBANopt-generated results to the REopt API and parsing back the optimized results for visualization with the Ladybug components:
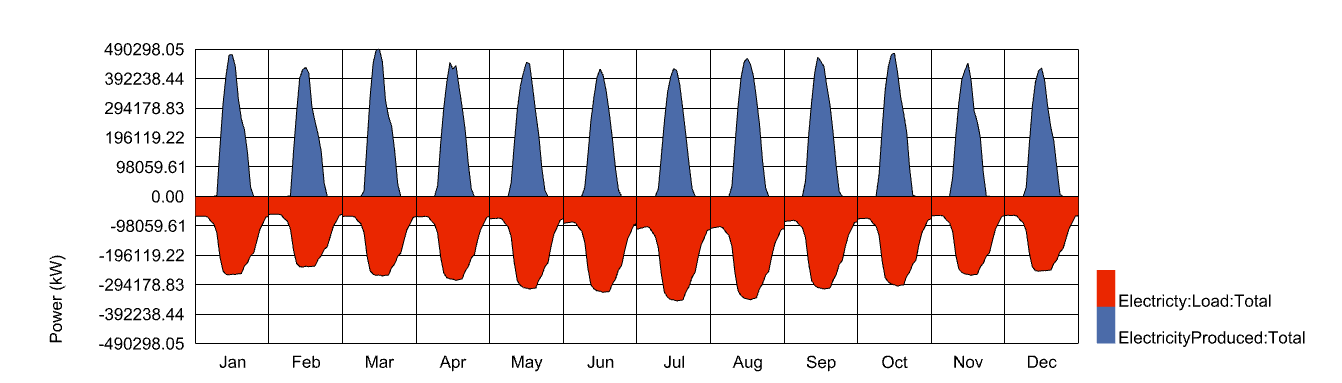
Click to read more
The second is a connection to [the OpenDSS application](https://sourceforge.net/projects/electricdss/), which can be used to size electrical equipment and power lines with checks for overloading of transformers and over/under voltage at the building level. The new Dragonfly components enable you build electrical network geometry in Rhino and assign properties to it in Grasshopper like so: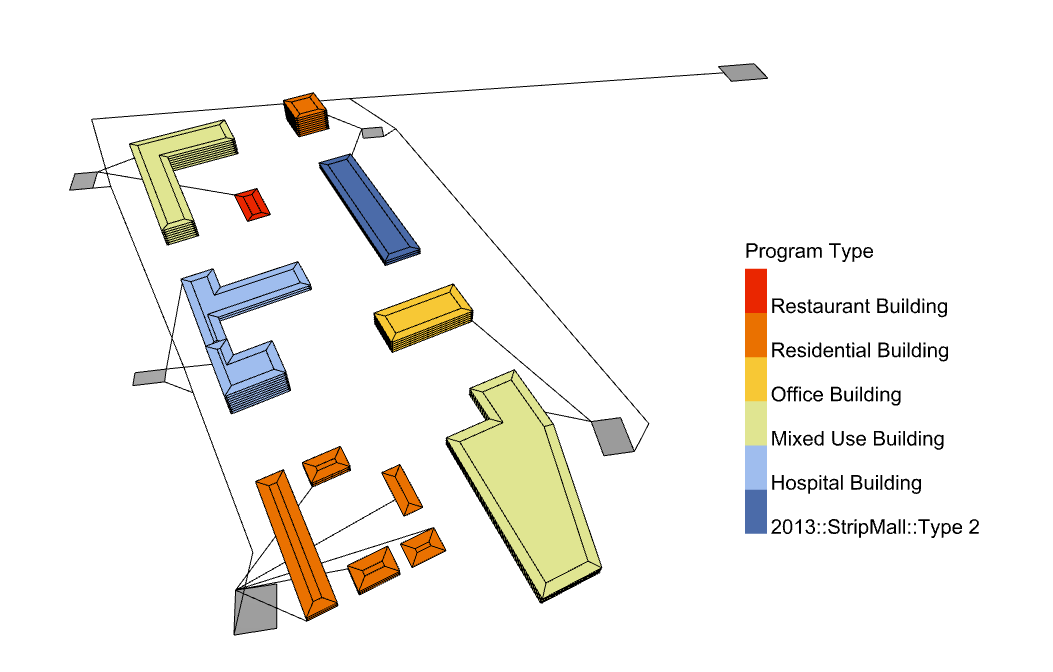
Given that typical electrification scenarios for the coming decades anticipate more than a doubling of electrical demand as fossil fuel boilers, water heaters, and other equipment are phased out, tools such as OpenDSS are needed to evaluate existing equipment and help plan new infrastructure.
Missing Legacy Features Targeted for the Next Stable Release
More Radiance Recipes - Now that the core structure of the recipes has settled, we aim to flesh out all of the critical Radiance recipes by the next release, including image-based and glare studies, point-in-time illuminance studies, and cumulative radiation studies.
More Ladybug Visuals - We are still missing important ladybug visualizations such as radiation-related graphics, the adaptive comfort chart, and analyses like shade benefit. We hope to get these in for the next release.
Improve Thermal Mapping Accuracy - The simplified longwave calculation in the LBT thermal maps is currently the only thing preventing us from saying that the LBT thermal maps are a clear improvement over their Legacy counterpart. So we aim to have
Additional Energy Features - We are currently missing a few important energy simulation features like simple daylight sensors and more issues that can be seen on the honeybee-energy Github. We hope to work our way further down this list before the next release.